Cushing predicting another crash in oil prices?

World GDP was half then what it is now. That's a LOT!. We were drowning in supply. Both WTI and Brent were in super contango. You can google that. But super contango is where the cost of storage basically goes parabolic because you run out of storage capacity. The yields to storing oil (the convenience yield) are so high that you make more money on the yield than selling the oil. Firms like Vitol and Trafigura were buying tankers like candy and storing oil all over the world. The ocean was full of these tankers just sitting on product. Everyone misjudged the economic recovery. We should have been hitting 2.5% GDP growth in 2010 and 2011 but we were stuck at 1%.

Then we had the crisis in Europe. Demand got killed there. Then throw in the fracking revolution which ironically came at the worst possible time and suddenly we tapped into oil we never thought we could reach. Then the Fed does a 180 and continues to printing money because they are afraid Europe takes us right back down into a recession. There were so many factors killing demand. Now you have all those things reversed going in the opposite direction. The world doesn't look anything like it did in 2010. How many people are talking about the Euro being torn apart? Nobody is, it's trading at 5 year highs. Now it's the dollar getting smoked. One thing you have to be careful of when looking at historical data is understanding context. It's the little subtleties that kill traders.

World GDP absolutely was not half of now in 2010. https://data.worldbank.org/indicator/NY.GDP.MKTP.CD

Which contango? This doesn't explain 2010 or much of 2011.
image014-7.png


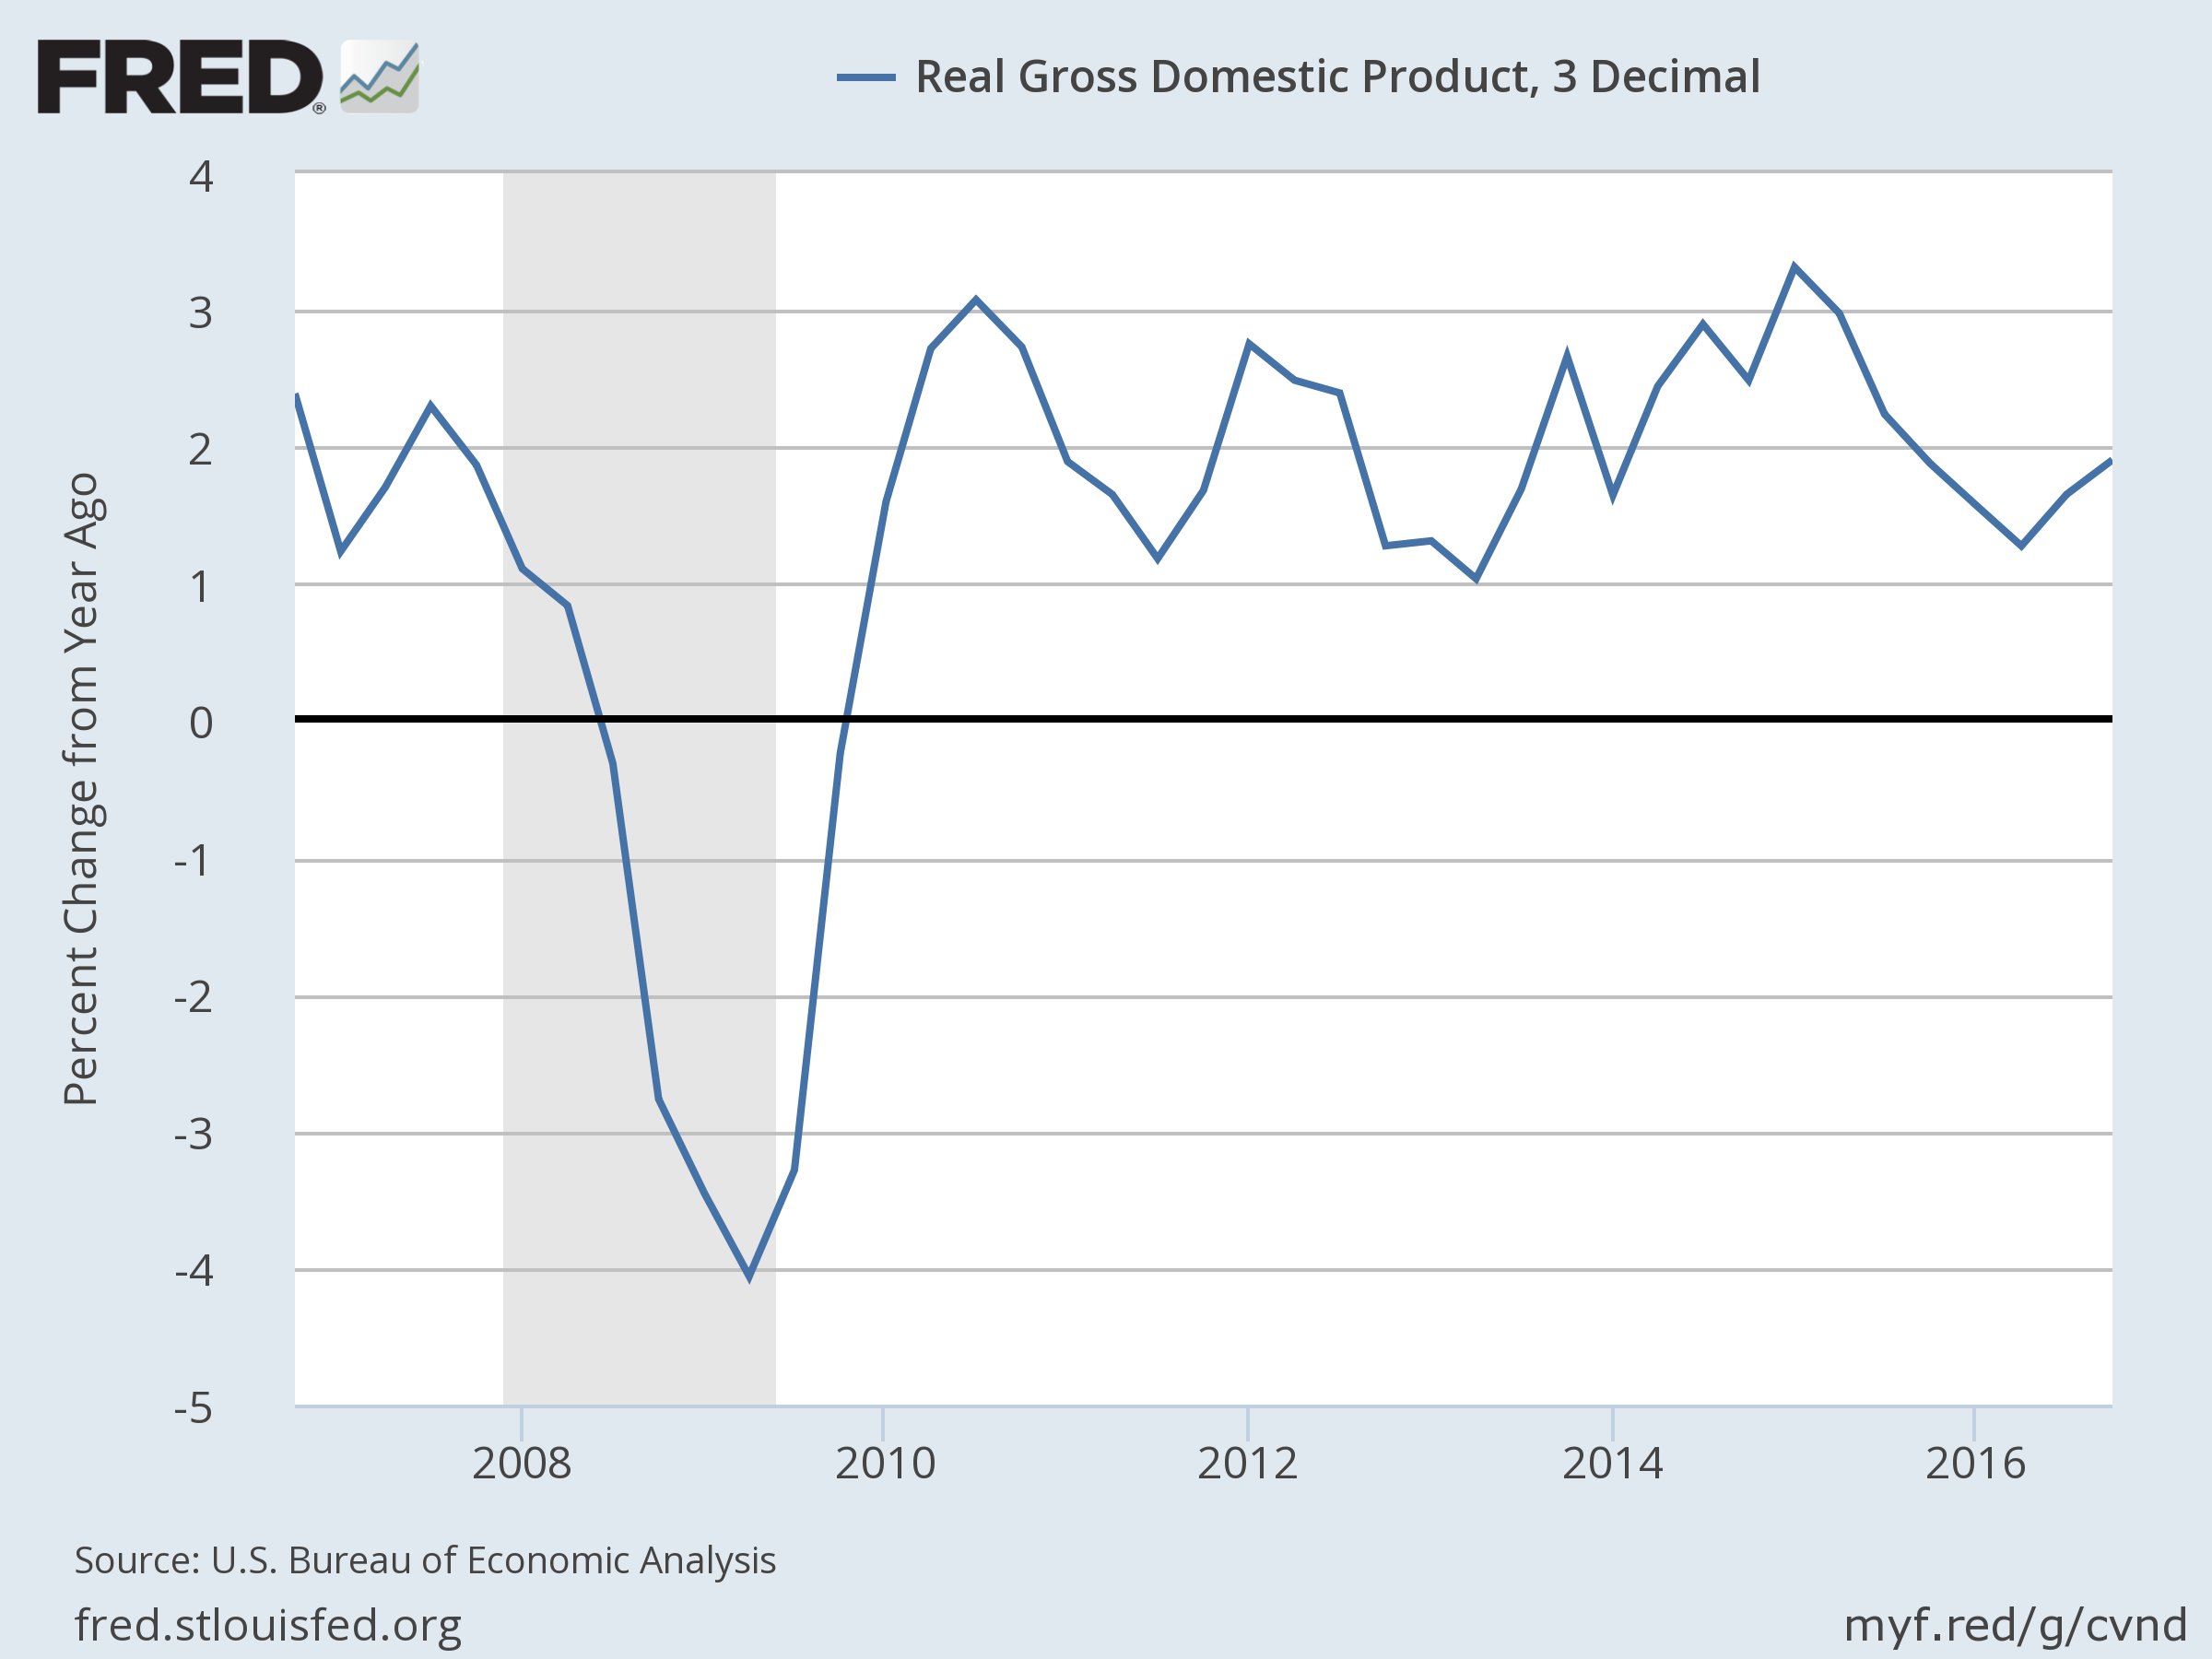
The GDP as demand issue doesn't support your narrative either.
saupload_20180405-pmi-img1-575px.jpg
 
That confirms my narrative that equity and oil crashes coincide and disproves the GDP-oil link since the stock market is not GDP.

https://fred.stlouisfed.org/graph/?g=jq8J

Oil crashes have nothing to do with equity crashes. In fact, they are Inversely correlated. Late credit cycle moves show rising commodity prices which raise input prices, which leader to lower corporate profit margins which leads to recessions. Oil was $147 a barrel in 2008.
 
In 2010 and 2011 we had 1% real GDP growth.

saupload_gdp.27jan2017.png

Wrong, since your own chart shows more than 1% growth, but by your own logic, oil should not have crashed in early 2010 or 2011.

That's not even the best chart to show the rate of activity. Annualized quarterly is best for that. https://fred.stlouisfed.org/graph/?g=jq94 Still no link.

Oil crashes have nothing to do with equity crashes. In fact, they are Inversely correlated. Late credit cycle moves show rising commodity prices which raise input prices, which leader to lower corporate profit margins which leads to recessions. Oil was $147 a barrel in 2008.

That is clearly not true. It's even easy to see from simple inspection. https://fred.stlouisfed.org/graph/?g=jq8J

I take it you forgot the oil-stock market link everyone was obsessed with pre-2014. https://fred.stlouisfed.org/graph/?g=jq8V
 
Last edited:
Wrong, since your own chart shows more that 1% growth, but by your own logic, oil should not have crashed in early 2010 or 2011.


That is clearly not true. It's even easy to see from simple inspection. https://fred.stlouisfed.org/graph/?g=jq8J

I take it you forgot the oil-stock market link everyone was obsessed with pre-2014. https://fred.stlouisfed.org/graph/?g=jq8V

I listed 5 different reasons why oil crashed in 2010 and 2011. Dude, you are not listening. You keep looking for ONE easy explanation to place a trade on. There is no such thing. There is nuance. A lot of people do this for a living and if it was so easy to look for one single predictor to forecast future prices, we would all be billionaires. That's what you don't get. And the stock market did not crash in 2010 and 2011 with oil prices. It's been very clearly documented that one of the primary reasons for the selloff was the fracking revolution and it coincided with several other factors that I listed previously into a perfect shit storm. Those factors are different today.
 
I listed 5 different reasons why oil crashed in 2010 and 2011. Dude, you are not listening. You keep looking for ONE easy explanation to place a trade on. There is no such thing. There is nuance. A lot of people do this for a living and if it was so easy to look for one single predictor to forecast future prices, we would all be billionaires. That's what you don't get. And the stock market did not crash in 2010 and 2011 with oil prices. It's been very clearly documented that one of the primary reasons for the selloff was the fracking revolution and it coincided with several other factors that I listed previously into a perfect shit storm. Those factors are different today.

The equity-oil link couldn't be clearer.

https://fred.stlouisfed.org/graph/?g=jq9h
 
The signal from Cushing only fired a few or so weeks ago.

My sense is that if indeed as your previous posts suggest you are considering bets on Crude Oil based upon storage inflows and outflows at Cushing, Oklahoma - you have a very limited understanding of the North American Crude Oil Basis. If a card game allows you five cards - why tell the dealer to stop dealing at one card?

I've seen CL trade in a 15% trading range with Cushing Rack Space remaining relatively constant.

If you are truly going to take on smart informed risk based upon storage then I would suggest you do the fundamental work because Cushing does NOT drive the market. In fact, many hydrocarbon experts would argue that Midland, Texas storage is more important than Cushing ! There are some other biggies that I can point you to in terms of Continental North America: Hardisty, Alberta. The Gulf Coast. And pipeline outages.
 
The equity-oil link couldn't be clearer.

https://fred.stlouisfed.org/graph/?g=jq9h

It's not. Where the hell are the crashes? What are you calling a crash? A 10% selloff? LOL. Please specifically point to what you are looking at. We've had one equity crash in the last 10 years. That market peaked in 2007 and bottomed in march of 2009. Oil prices "rallied from 45 to 147 in 2007 into 2008. Oil prices "peaked" near the equity "lows". Oil prices got crushed in 2009 when equities rallied hard off the march 2009 lows. Equities continued to rally as oil continued to sell off. Now please point to me, and for the love of god, be specific exactly what you are looking at.
 
Back
Top