You are using an out of date browser. It may not display this or other websites correctly.
You should upgrade or use an alternative browser.
You should upgrade or use an alternative browser.
Crash Monday? SVB contagion, VIX spike
- Thread starter KCalhoun
- Start date
thanks a lot!Have them see if this makes any difference. this is the area ( in yellow outline) I am talking about, I'm using closing price only, but optimally using actual price vs volume might be bettter.
@NCC, never a dumb question with me. We all start somewhere.. SMA = simple moving average
so by the word simple, do you mean a non-weighted sum and divide?
Hey Ken, Since you are th OP, I took some time this morning to see some of your posts and it seems you are way too biased short side?
Since it was your thread that instilled me to register and post my thoughts, (getting smoked/grilled/broiled in the process) I'll share a bit my thoughts and what has been working for me. One day this strategy may not work, but it should not hurt you much when it doesn't.
My bread and butter so far has been using the 1hr charts and its 50sma. Of course, I use more indicators, but too much to go into all of them and I don't have time like some of you. But if I were to teach this to my teenage daughters, it would be using just this.
The slope of the 50sma is a key component in my actions.
For example, if the slope is negative (-), and the futes break to the upside, there is a high probaility to revisit or even break back below soon again and the probability's time frame is within 3-4 bars = 3 to 4 hours. This is one of the best time to short... when it breaks below the 50sma while the slope is negative. The acceleration @ delta vs risk is huge for the short play during these setups! That's your edge!
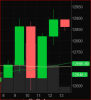
The NQ mkt was in a transistion period Monday after close to Tues @ 12100.
I say transition because the slope of the 50sma went from - to flat +.
On Wed @3:30am, as everyone was so negative waiting for the world to crash the NQs were trading steady at 12100. The math says if it doesnt go below 12000, the slope will not go negative so a break back above the 50sma would mean emphatically risk on.
Go back and look at my post of when I bought the stocks in my equities account. I was waiting for a break below 12000 and would buy if it went back above, but it never did so I had to buy as it flirted with 12150 @ 19sma. my style never gets lowest or highest prices.
I was sure enough of myself (murphy's law and all) to make my very 1st post on here saying I am buying.
I called the ES 3919 because its 50sma was there and its slope was still negative, and projected to be negative for the time left even if es traded instantaneously traded above it for the remaining 3 or so hours.
When I sit down at the desk, my thought process is like this. I am trading against the smartest HFT teams, data scientists, physicists, and analytical minds of code breakers etc. That's a lot of complex math modeled into them. But, you don't need to beat all of them, doesn't work that way. You just need to be on the side of the ones who are making a difference in the time frame you are using. SO far the 50 on the hrly seems to show their behavior.
It's pseudo-randomness and organized chaos.
One other thing I have noticed is if you are on the correct side of the slope and the current trade is against you, you have a high probably to get out at smaller losses than if you are on the wrong side of the slope with your trade.
I traded all long Futures on friday, like 40 round trips or so. ( well except for 1 mistake short).
I was profitable on just about everyone of them... that's not me but more because I was on the right sode of the slope.
Anyway, don't discount what I have written like a lot of others did initially. It's working. I'll be the first to let you know when it doesnt.
I think I follow, but my problem isn't so much entry as what I do after entry. So when you say go short for example, how much are you looking for or do you trail with a stop? How do you decide it isn't working?
Curious was that just NQ and ES or other symbols as well?
Anyway why so many intraday trades if you are using MA slope on a one hour chart basis?
Ok, first of all: Everything written in this forum by me is my personal opinion and is for information only, should not be construed as financial, investment, legal, tax, or any other advice, and I disclaim all liability in respect to actions taken based on any or all of my opinions.
It works with ES and lots of the major equity names. I chose the NQ's because there are only 100 underlying so I can take a look at, say, the top 25's chart rather quickly to get a more detailed "under the hood" look.
The 50sma (yes, just the mean of the last 50 hrly closing price) its self guides me to be long or short. The slope of the 50sma on the 60min when the futes crosses gives me extra confidence in the direction. I would estimate 90% of my trades are based off the 5min charts (others 1min or 3min). Once I'm in a position, there are 12 bars per hr that dictate my actions.
I would love to NOT have to make so many trades, the commissions are currently running ~3% of portfolio
 but I leanred quickly that, my account is too small to just do mini NQs in this volatility.
I think I follow, but my problem isn't so much entry as what I do after entry. So when you say go short for example, how much are you looking for or do you trail with a stop? How do you decide it isn't working?
I DO NOT enter a trade based on what I think I will make or a tgt other that it should trend in the direction I am expecting. Take a close look at the picture I posted of my 2 screens. You can see that I can't really see the PL window (circled red) of the positions. I used to have it and it would just distract me.
I DO enter a trade knowing exactly where my stop should be (explain later) and a definitive Hard stop which originally was 12 pts when I first started, now at 25pts.
I normally use the 5 min exclusively for my closing positions (extremely volatile sessions dictate the 1 or 3min as written previously). the 19sma on the 5 min gives a lot of clues.
If you don't have enough experience to start recognizing 5 minute data than Patience is your your #1 hedge! Just WAIT and make your trades around the 50sma. Generally, being short when the futs cross/stay under and being long when it crosses/stays above should be a viable strategy.
From here, one can optimized with closing hrly price action and underlying price action using 5 and 15 min.
I have to end this post here for now (have to attend a banquet where both my daughters may place in a science/engineering fair in their own individual project.. yes, I'm proud of them.. but I rarely let them know that
") ...
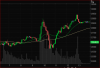
...I'm including the 60min and 5 min chart from Feb7 for reference. See how the 60min crossed over/under the 50ma. Thats some heart breaking whips don't have smaller time frames to trigger the trades.
Study the 5 min charts of those 4 hrs, burn those images into your brain. Look at how the candles were at:
9:30 (my time is PT zone),
10
11:25
11:40
12
12:50
From 10:30 to 10:50- those 5 candle pattern happens a lot for major reversals, that's almost the "2nd mouse cheese thing".
ok gotta go, remind me later about trailing stops (yes I use them when appropriate), closing tgts and the excel projection spreadsheet.
Attachments
Last edited:
Great film scene your icon's from.I think I follow, but my problem isn't so much entry as what I do after entry.
So when you say go short for example, how much are you looking for or do you trail with a stop? How do you decide it isn't working?
10 Ways Traders Take Profits
https://elitetrader.com/et/threads/the-myth-of-letting-your-winners-run.345542/page-28#post-5376530
8 targets in trading
https://elitetrader.com/et/threads/...t-right-here-baby.335635/page-20#post-5358043
Stops, trailing stops.
When I got a chance to glance at the charts this morning, the 60min NQs had crossed over/under the 50ma 5x already. Gave me a hint to what the day may be like, especially after gapping last nigh and the day after 3x witching which means usually is a rebalance day.
If I had no clue about the day, as during days when I first started... I prob would have taken a lot of stop losses on the nqs.
But seeing how it gapped last night and the strength of ES today, there is no reason NQ should be below the 50. Anyway, this made me go slow today. I ended up eaking out a profit on Nqs, but was able to open and close an NDX spread to help make 3%.
The way I establish my stops goes something like this. When the setup is right, and NQ is about to cross over or under, I start to establish positions with 1-2 micros these typically are +- ~5 points from the cross. These initial positions have an initial stop of the previous bars low or high. Once the cross is made, I scale in a bit more.... these new positions have stops of +- 10pts of the actual 50ma depending on if you are long or short.
I only use trailing stop if I have to leave the desk and believe the mkt will still provide more prfoit, but my stop on these are around 7pts max.
Today's action has the 50ma sloping up all day. The inital break down at midnight, afterwards took 3 bars to retake. every closing break after took 1 bar so far. This is pretty bullish.
I'm bullish for the day but since I have to tend to personal things calling it quits.
Oh, on days like this, it's easy to do a bull put spread and make decent money. I'm guessing we'll close ~ 12677ish
Edit: Oh, the odd fill is due to me closing the spread at individual timing trying to maximize profit. I close the short P first and as mkt track back down closed out the long P.
Attachments
Last edited:
Like I said previously, just curious is all. MA's I decided we're not my thing loooong ago.Ok, first of all: Everything written in this forum by me is my personal opinion and is for information only, should not be construed as financial, investment, legal, tax, or any other advice, and I disclaim all liability in respect to actions taken based on any or all of my opinions.
It works with ES and lots of the major equity names. I chose the NQ's because there are only 100 underlying so I can take a look at, say, the top 25's chart rather quickly to get a more detailed "under the hood" look.
The 50sma (yes, just the mean of the last 50 hrly closing price) its self guides me to be long or short. The slope of the 50sma on the 60min when the futes crosses gives me extra confidence in the ....
No need for disclaimers on my accord. Still don't get why slope of MA for so many trades - unless you use other things to trigger a trade, besides 19SMA on 5min? But that's ok. Carry on.
@1eyejackal How do you calculate the slope of SMA? How many bars you lookback to find the slope?
Stops, trailing stops.
When I got a chance to glance at the charts this morning, the 60min NQs had crossed over/under the 50ma 5x already. Gave me a hint to what the day may be like, especially after gapping last nigh and the day after 3x witching which means usually is a rebalance day.
If I had no clue about the day, as during days when I first started... I prob would have taken a lot of stop losses on the nqs.
But seeing how it gapped last night and the strength of ES today, there is no reason NQ should be below the 50. Anyway, this made me go slow today. I ended up eaking out a profit on Nqs, but was able to open and close an NDX spread to help make 3%.
The way I establish my stops goes something like this. When the setup is right, and NQ is about to cross over or under, I start to establish positions with 1-2 micros these typically are +- ~5 points from the cross. These initial positions have an initial stop of the previous bars low or high. Once the cross is made, I scale in a bit more.... these new positions have stops of +- 10pts of the actual 50ma depending on if you are long or short.
I only use trailing stop if I have to leave the desk and believe the mkt will still provide more prfoit, but my stop on these are around 7pts max.
Today's action has the 50ma sloping up all day. The inital break down at midnight, afterwards took 3 bars to retake. every closing break after took 1 bar so far. This is pretty bullish.
I'm bullish for the day but since I have to tend to personal things calling it quits.
Oh, on days like this, it's easy to do a bull put spread and make decent money. I'm guessing we'll close ~ 12677ish
Edit: Oh, the odd fill is due to me closing the spread at individual timing trying to maximize profit. I close the short P first and as mkt track back down closed out the long P.
Oh,the disclaimer wasn't meant specifically for you but as general statement just to protect me in case some yoyo gets any ideas...Like I said previously, just curious is all. MA's I decided we're not my thing loooong ago.
No need for disclaimers on my accord. Still don't get why slope of MA for so many trades - unless you use other things to trigger a trade, besides 19SMA on 5min? But that's ok. Carry on.
@1eyejackal How do you calculate the slope of SMA? How many bars you lookback to find the slope?
For the slope, it's 50 closing prices (60min = hrly). The rate of change (ROC) as Dest alluded to in one of his earlier post sometimes makes a difference. I havent gotten meaningful correlation yet. Steep slope, mild slope and flat.. at what angle the indices cross often times give you a clue as to how far it penetrates and for how long and it's not what most would think. Do your research and you will see. I've given much more info than I had initially intended and I think the info is meaningful enough to add and tweak one's trading.
Anyhow, before I took my daughters to school today I made sure to get up at 3am to see if I can make some trades knowing the NQs crossed above the 50 at the close yesterday.
I was flat till about 3:45am when I put on 2 micros using 5min chart as roadmap. I missed adding a mini at around 4:10 so had to wait til next consolidation, which wasn't til 5:15. Put on a mini and almost got stopped out @5:45, but the 1 min chart gave clear pattern to stay long ( actually to add, but I was already near my max position limit which is 1.5 mini contracts = 1 mini + 5 micros). If account gets to 100k, I'll start trading max of 2.5minis.
Anyway the rest was history until the action at ~6:55am gave me conviction to go short.
I wrote about the "5 bar reversals" usually reversing the current ST trend... but, if it doesn't, trend gets magnified.
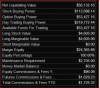
Anyway times stamps of the actual trades to show and account balance after closing futes so I can take my kids to school.
Attachments
You are welcome.This statement has been noted.
VIX under 22 after fed next week.