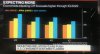
Can a greater mind please explain what this chart means?
I picked it up Friday from BB news.
- What does the drop in percentage mean as time (here, in quarters) moves forward?
- What exactly is consumer sentiment?
- Economist fears are driving it lower? Why
I'd think that inflation fear would push the expectation higher.

I picked it up Friday from BB news.
- What does the drop in percentage mean as time (here, in quarters) moves forward?
- What exactly is consumer sentiment?
- Economist fears are driving it lower? Why
I'd think that inflation fear would push the expectation higher.