Back-Testing the Robert Lichello Automatic Investment Management (AIM) System for Timing the Stock Market
Doug is a Systems and Industrial Engineer with a master's degree. He lives in Gilbert, Arizona.
Canva
Many have said the most important purpose for investing is to make money. In order to make money, we face two key decisions: when to buy and when to sell. Simply put, we must buy when prices are low and sell when prices are higher than the buy price.
The difficulty is in the implementation. Our emotions work against us; when markets are rising, there’s a jubilation that makes it very easy to join in and buy when prices are high and moving higher. When markets are low, it can seem like there is no bottom and the market will never bounce back, which makes it easy to follow the herd and sell low.
A System to Reduce the Emotion of Investing
Ideally, what we need is a system that will reduce the emotion of investing by automatically telling you when to buy, sell, or do nothing. In the late 1970s,
Robert Lichello published a book titled
How to Make $1,000,000 in the Stock Market—Automatically, which presents a stock market timing system that claims to do exactly that. In this article, we will briefly explain this system then back-test it to see if there is any credence to these claims.
Sensitivity Analysis.
- If you want to see how to use the AIM system in a multi-ETF portfolio, go to this article: Multi-ETF Analysis.
What Is AIM?
Robert Lichello named his market timing system Automatic Investment Management or AIM. AIM is an algorithm that provides a logical system for managing your investments. It can be used with a stock or mutual fund portfolio. This system will instruct you when and how much to buy or sell.
To calculate AIM’s buy and sell quantities, you need to know two things: how much money you have invested in the portfolio and the current value of your portfolio. To illustrate, let’s run through a couple of examples.
Example of a Buy Order
- Portfolio Control (Amount of initial investment) = 1000 shares @ $10 per share = $10,000
- One month later the stock price falls to $8, Portfolio Value = $8000
- Add 10% to the current portfolio value = $8800.
- Subtract 8800 from 10,000
- Which equals = $1,200
Note, a positive value indicates a buy signal. However, if this value were negative, then AIM is telling us to hold.
Because the value of your investment has decreased, AIM has signaled you to buy 150 shares, the equivalent of $1,200.
One of the interesting features of AIM is each time that you buy more shares, your portfolio control increases by half the purchase value. In this case, the portfolio control would increase to $10,600. This is a built-in risk regulator that will stop you from exhausting your cash reserves when the market is going down or building too much of a cash reserve when the market is going higher.

Non-Directional Stock Trading for Better Probability of Profit

How to Generate Monthly Income From Options Selling
Predicting the Direction of Stock Market Using Bull/Bear Ratio Sentiment Indicator
AIM Websites
AIM in the Real World
So, does AIM work in the real world? To answer this question we will use historic stock prices and run the AIM algorithm through its paces. We will use historical prices of one of the most active exchange traded funds (ETF), The S & P Depository Receipts, stock symbol SPY. SPY is an ETF that tracks the Standard & Poors index of 500 stocks.
From January 2000 to July 2016 the SPY price history has ranged from $68.11 to $217.12. During this period there has been two downturns in the stock market, one 5-year period of increasing prices and of course the current price increases since March of 2009. So we can test AIM through a couple buying phases, at least one selling phase, and get a read on the current market.
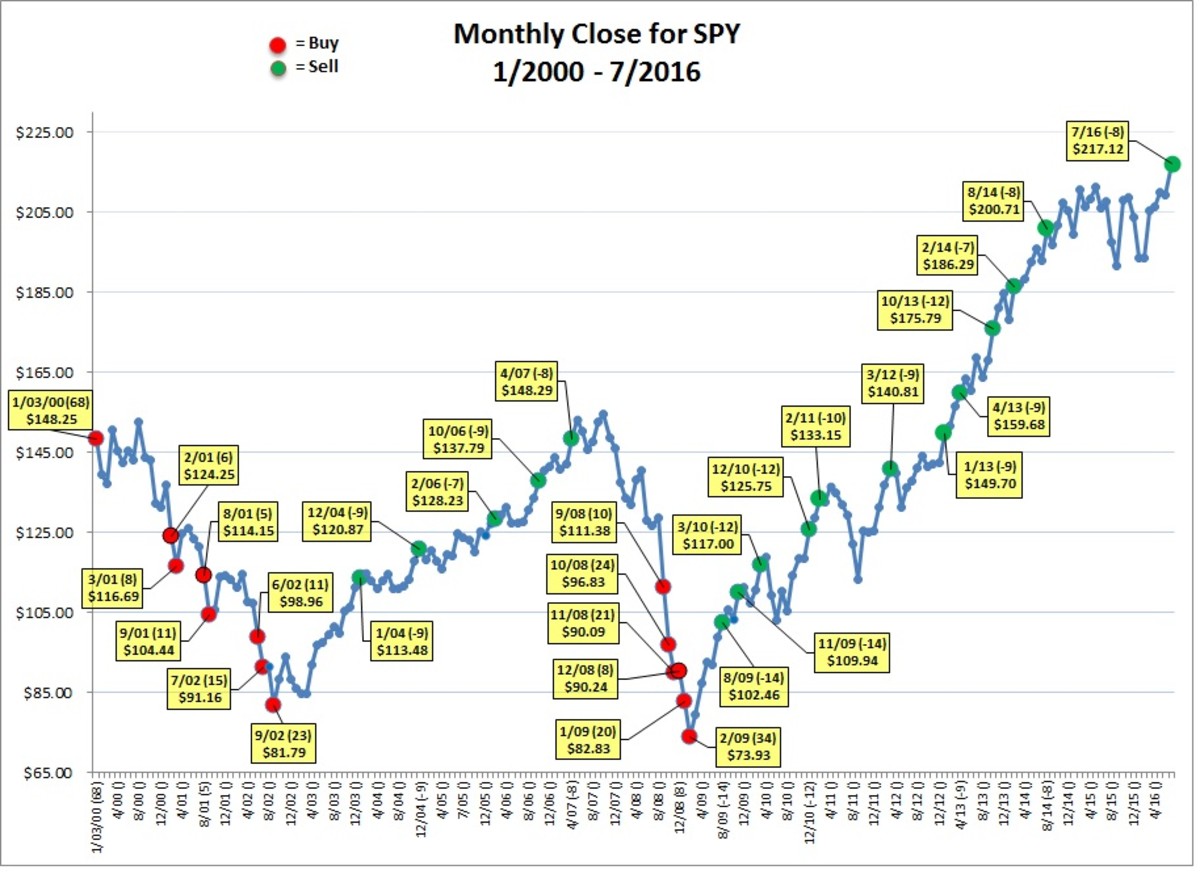
Now, let’s look at the results of the back-testing which is summarized on the time series graph shown below. All buy and sell transactions are noted with yellow text boxes that show the month/year, quantity bought or sold and closing price at the end of that month. Additionally, buy transactions are denoted with red markers, sell transactions denoted with green markers.
Results of the Back-Testing
The first thing we notice is that the initial purchase of 68 shares on 1/3/2000 is very near where the market peaked in August of 2000. Then as the market fell for the next two years AIM had us accumulating a total of 79 shares over seven distinct buy signals in February, March, August and September of 2001, and June, July and September of 2002. During this buying phase, we used up a most of our cash reserves leaving us with $2,919 in cash "insurance" should the market continue to decline. Additionally, our number of shares has increased by 116% from 68 shares to 147 shares, more than doubling our "potential" increase in equity value when the market trend turns up. Assuming FIFO accounting our average price per share has been reduced from $143.80 to $121.21.
After the market bottomed in 2002, we experience a 5-year period of rising prices. During this period, AIM would have us selling a total of 42 shares at five distinct selling opportunities in January and December 2004, February and October 2006 and April 2007. At the end of this selling phase AIM has us building up cash reserves to $9,989 and we are holding 105 shares. Average price per share is $78.85.
From the market peak in October 2007 there is nearly a straight-line tumble until February 2009. During that freefall, AIM has us accumulating a total of 117 shares over six distinct buy signals from September 2008 to February 2009. At the end of this accumulation phase AIM has almost depleted the cash reserves to $809 and we are now holding 222 shares at an average price per share of $97.86.
Finally, the market picked up from March of 2009 through July 2016. During that period AIM issues 12 sell signals for a total of 124 shares. At the end of this selling phase AIM has us building up our cash reserves to $21,149 and holding 98 shares at an average price per share of $82.76.
Conclusions
In spite of the initial purchase being close to a market top, the overall portfolio performance is not bad. As of 7/31/16 the hypothetical portfolio consists of 98 shares of stock and $21,149 in cash reserves for a total of $44,164 or a gain of 120.8%. Employing a buy and hold strategy would have resulted in a total of $31,839 or a gain of 59.2%.
AIM appears to do a good job of inventory management and control as exhibited by our cash reserves increasing by 111.5%, our share ownership increasing by 44.1% and the average price per share of $82.76 which is a redution of 44.2%. However, one risk came out during the second accumulation phase, we very nearly ran out of cash in April 2009. We had only $809 (4% of the total portfolio value) to buy more shares, nearly exhausting our cash reserves.
During the two market downturns AIM caught both bottoms with buy signals, on the up side AIM missed selling at the 10/2007 peak.
Overall the AIM system appears to do a good job of identifying key buy/sell points. If you are disciplined enough to act only when AIM tells you to buy/sell much of the emotion of investing can be eliminated.
If you are interested in obtaining the source data for this analysis in spreadsheet form, send an email to
dougburkeaz@gmail.com with the words “AIM Back-Test” in the subject line.
Assumptions for Back-Testing AIM
It is always necessary to make some basic assumptions when doing an empirical analysis. Here is the list for this analysis:
- Initial amount to invest in the stock is $10,000
- Cash reserve of $10,000 for future purchases
- AIM decisions are based on the closing price of the stock on the last trading day of each month
- Buy or sell price is the open price of the stock on the 1st trading day of each month
- Buy or sell order not executed unless the order is +/- 5% of the equity value
- Stock trading commission is $10.95 per trade
- Rate of return on Cash reserve is 2% APR
- Dividends distributed into cash account, not reinvested