You are using an out of date browser. It may not display this or other websites correctly.
You should upgrade or use an alternative browser.
You should upgrade or use an alternative browser.
concept for adjoining (rough) realized index values to the (smooth) interpolated term structure curv
- Thread starter steve42
- Start date
I dont do pairs trading, its called cointegration though%%
HIGHEST correlation, can do better than that.
A bit like trading oil stocks/oil stocks ETFs, based on price of oil, not much help, but a bit better than nothing..................................................................................
In other words SPY is correlated to QQQ ;
but mainly+ mostly SPY correlated to itself
No they come from the price of the futures contracts The index values are only known up to the present moment but the futures prices are projected prices at future moments based on information available at the present momentdont you create the interpolated curve from the index values? so those points are already on the cyrve
not sure what you are going for. But are you trying to see a spot price along a forward curve?No they come from the price of the futures contracts The index values are only known up to the present moment but the futures prices are projected prices at future moments based on information available at the present moment
I'm trying to combine two elements of the UI that would normally be in separate parts into onenot sure what you are going for. But are you trying to see a spot price along a forward curve?
@steve42
I think this will be useful....
I do something along those lines, but it takes extra steps to set up (in TOS platform).
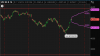
- In my case, the "price forecast" is just the "probability of expiring" tool (which is based on current options pricing i.e. market expectations)
- TOS then allows you to do a few more steps to draw the (red) lines of where your breakeven points are.
Do you want to use this UI for futures pricing, or your own vol forecast?
I think this will be useful....
I do something along those lines, but it takes extra steps to set up (in TOS platform).
- In my case, the "price forecast" is just the "probability of expiring" tool (which is based on current options pricing i.e. market expectations)
- TOS then allows you to do a few more steps to draw the (red) lines of where your breakeven points are.
Do you want to use this UI for futures pricing, or your own vol forecast?
Attachments
Yeah something like that very close I didn't envision using a price range just like you did there I was envisioning literally using the futures term structure for the same instrument which would give the average expectation and then I could apply the implied volatilities to generate the width on the thing like you have there in your chart but very nice thanks for sharing@steve42
I think this will be useful....
I do something along those lines, but it takes extra steps to set up (in TOS platform).
- In my case, the "price forecast" is just the "probability of expiring" tool (which is based on current options pricing i.e. market expectations)
- TOS then allows you to do a few more steps to draw the (red) lines of where your breakeven points are.
Do you want to use this UI for futures pricing, or your own vol forecast?
I'm envisioning using it for both One of them being the market expectations and the other one being the calibrated market forecast which should almost always be the same because the model that I am implementing is known to calibrate perfectly even for short durations but it can tell you for instance perhaps useful information to see the slight deviations between those and to also make manual adjustments to the implied future structure if you have some personal expectation that deviates from market expectations@steve42
I think this will be useful....
I do something along those lines, but it takes extra steps to set up (in TOS platform).
- In my case, the "price forecast" is just the "probability of expiring" tool (which is based on current options pricing i.e. market expectations)
- TOS then allows you to do a few more steps to draw the (red) lines of where your breakeven points are.
Do you want to use this UI for futures pricing, or your own vol forecast?
Hello fellow traders,
I'm in the process of developing an interface for a volatility trading program. The aim is for it to aid in market positioning by acting as a comprehensive dashboard. Traditionally, we see separate windows displaying price action history up to the present moment and another for the VIX futures curve.
However, I'm contemplating a design where, as time progresses, the projected VIX futures term structure (interpolated curve) transitions to reflect the actual market developments. This would result in a graph that smoothly interpolates between the fixed points of futures contracts but adjusts abruptly with each new price data point, be it the last traded price, ask, or bid.
To my knowledge, I haven't come across such an approach in other software or academic papers. It feels intuitive, but I'd love to hear your thoughts.
insights and feedback appreciated
You already have the synthetics in the weekly options. Why would you use only the futures to interpolate?
That's a great point I wouldn't . I haven't got all that part there yet because the models that I have for pricing are for options only (jointly calibrating to SPX and VIX at the same time with the same parameters) they are similar to the future pricing's models but I just haven't got to that stage yet.You already have the synthetics in the weekly options. Why would you use only the futures to interpolate?
I understand you can simulate volatility options like Vicks on single name stocks with synthetics but you have to basically rehedge those constantly to keep them in line do you not and the spreading commissions eat up most of it?