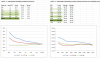
Coffee has jumped recently and I wanted to see how two common methods of ATM IV measurement compared on a day with a large move in the underlying (today). A quick and dirty analysis is attached.
If one is just using the data to keep an eye on things via a time series chart, the IV Index provided by ivolatility.com (using interpolation to get a constant maturity) seems to be fine. It should be spot-on compared with the 'traditional' measurement if a 30-day IV Index increment matches the term of a particular option month (see shaded comparisons). One big honkin' caution is in order, however, when there's a significant skew in the IV term structure , e.g. coffee today or natural gas the last couple of weeks.
Note: I'm just comparing the two measures on February 3. The IV Term Structure/Forward Vol Curve has additional dates, but they're not the same for each data set.
Nothing earth shattering, I know. I'll have to come up with another project if I ever expect to win the Nobel Prize.
If one is just using the data to keep an eye on things via a time series chart, the IV Index provided by ivolatility.com (using interpolation to get a constant maturity) seems to be fine. It should be spot-on compared with the 'traditional' measurement if a 30-day IV Index increment matches the term of a particular option month (see shaded comparisons). One big honkin' caution is in order, however, when there's a significant skew in the IV term structure , e.g. coffee today or natural gas the last couple of weeks.
Note: I'm just comparing the two measures on February 3. The IV Term Structure/Forward Vol Curve has additional dates, but they're not the same for each data set.
Nothing earth shattering, I know. I'll have to come up with another project if I ever expect to win the Nobel Prize.