Technical analysis is frequently used as a somewhat good way to design trading strategies provided one has done a serious backtesting, does not fall into the overfitting trap, knows the probabilities well and sticks to the odds. I decided to investigate the combination of technical analysis and machine learning to design seriously profitable trading strategies.
The Quantitative trading strategy i talk about in this post is being actively traded in the investment club I belong to. So unfortunately, I won’t be able to explain the ins and outs of the strategy. However, I will share the backtesting results and mention a few elements.
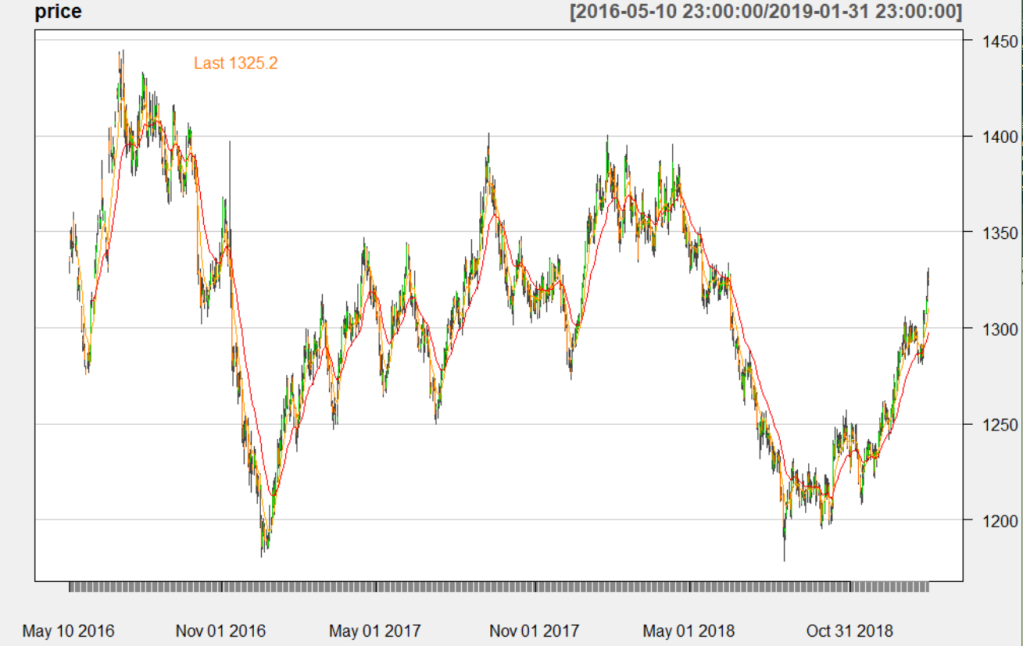
So in a nutshell, the strategy is pretty much simple. It is based on using daily market data for particular asset clases: Futures contract for commodities and indices. Here, I will show the results for Gold futures. The trading strategy came about as I was looking at daily price chart (candlesticks) for multiple asset classes. I realized that whenever the daily closed price was above the Ema7, price had the tendency to go upwards the following days. So I decided to test it.
The data I used for gold goes from 2016 to October 2018. See price chart below. I got the data from my broker (which I won’t mention here) but you can obtain such daily price data for gold futures easily online. You can see in the chart below that the price goes up and down over the last couple of years.
I used the statistical programming language called R to carry out the research and backtest of the strategy. The strategy consisted of buying 1 gold contract the next day if the current day close price is above the Ema7. I would also short 1 gold contract the next day if current day closing price is below EMA7. No trade is carried/kept till the next day which means that all trades are open and closed the same day. So the EMA7 was the only technical indicators used for the strategy. The next bit of it was to use machine learning. I used a particular algorithm to tune the strategy such that the profitability would increase and the duration and trough of the drawdowns would decrease. The figure below shows the resulting equity curve excluding commission costs.
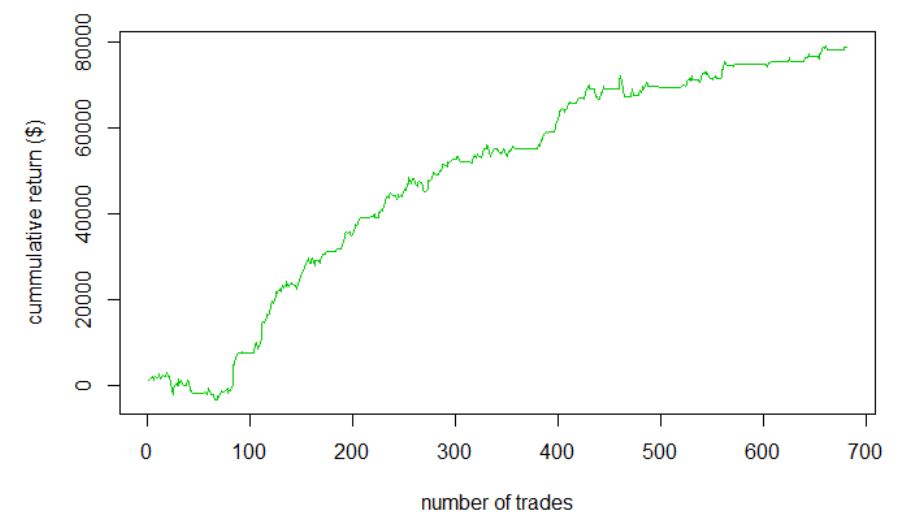
Equity curve of the Gold machine learning enhanced Ema7 strategy
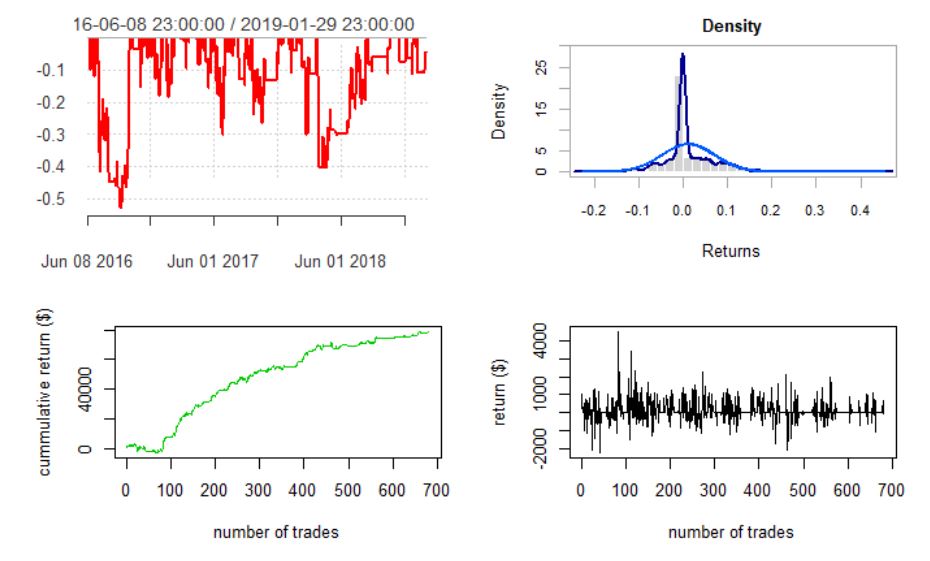
This equity curve looks great and this strategy turns out to be highly profitable. But the equity curve is not enough, it is important to look at other risk elements like drawdowns, trades stats, sharpe ratio etc… Here I will focus on the drawdown which can be quite significant and intimidating. If proper analysis of the drawdowns is not done, one can be exposed to the risk of failure by now not understanding fully the returns and stopping the strategy prematurely. In the figure below, we can see that the drawdowns (red line chart) can such in some instances -50% of the starting capital which in this case was 10000$. The length and trough varies obviously depending on market volatility. Also as you can obverse on the distribution, the strategy has a lot of zero $ trades. These are times when no trading happen and there given certain signals, the algorithm would not execute a trade. Overall the strategy looks really robust and highly profitable delivering close to 800% return in no less than 2.5 years.
The Quantitative trading strategy i talk about in this post is being actively traded in the investment club I belong to. So unfortunately, I won’t be able to explain the ins and outs of the strategy. However, I will share the backtesting results and mention a few elements.
So in a nutshell, the strategy is pretty much simple. It is based on using daily market data for particular asset clases: Futures contract for commodities and indices. Here, I will show the results for Gold futures. The trading strategy came about as I was looking at daily price chart (candlesticks) for multiple asset classes. I realized that whenever the daily closed price was above the Ema7, price had the tendency to go upwards the following days. So I decided to test it.
The data I used for gold goes from 2016 to October 2018. See price chart below. I got the data from my broker (which I won’t mention here) but you can obtain such daily price data for gold futures easily online. You can see in the chart below that the price goes up and down over the last couple of years.
I used the statistical programming language called R to carry out the research and backtest of the strategy. The strategy consisted of buying 1 gold contract the next day if the current day close price is above the Ema7. I would also short 1 gold contract the next day if current day closing price is below EMA7. No trade is carried/kept till the next day which means that all trades are open and closed the same day. So the EMA7 was the only technical indicators used for the strategy. The next bit of it was to use machine learning. I used a particular algorithm to tune the strategy such that the profitability would increase and the duration and trough of the drawdowns would decrease. The figure below shows the resulting equity curve excluding commission costs.
Equity curve of the Gold machine learning enhanced Ema7 strategy
This equity curve looks great and this strategy turns out to be highly profitable. But the equity curve is not enough, it is important to look at other risk elements like drawdowns, trades stats, sharpe ratio etc… Here I will focus on the drawdown which can be quite significant and intimidating. If proper analysis of the drawdowns is not done, one can be exposed to the risk of failure by now not understanding fully the returns and stopping the strategy prematurely. In the figure below, we can see that the drawdowns (red line chart) can such in some instances -50% of the starting capital which in this case was 10000$. The length and trough varies obviously depending on market volatility. Also as you can obverse on the distribution, the strategy has a lot of zero $ trades. These are times when no trading happen and there given certain signals, the algorithm would not execute a trade. Overall the strategy looks really robust and highly profitable delivering close to 800% return in no less than 2.5 years.