I am looking for a way to see the stock chart which shows each day’s close price as an up or down bar and also how much up or down. I prefer thinkorswim as that is my broker. Anyone has any idea on how to do this? Thanks very much.
You are using an out of date browser. It may not display this or other websites correctly.
You should upgrade or use an alternative browser.
You should upgrade or use an alternative browser.
Close price as up or down bar
- Thread starter emulimu
- Start date
Candle stick and bar charts will show you opening and closing prices
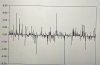
I got the up and down bars alright but the numbers are not accurate. If the difference between yesterday’s close and today’s close is 10 in SPY, it’s showing 1/4th of that. Any idea how to see the actual difference? ThanksYou can use the rate of change (ROC) with length = 1 and maybe you can set the plot style as bar instead of line.
Yes I know but I need the difference between yesterday’s close and today’s close as a number. This tells me how much a stock is moving each day.Candle stick and bar charts will show you opening and closing prices
I got the up and down bars alright but the numbers are not accurate. If the difference between yesterday’s close and today’s close is 10 in SPY, it’s showing 1/4th of that. Any idea how to see the actual difference? Thanks
Maybe because ROC is based on Open but if you can't chose Close as the source then I don't know ...
I don't have ToS but I see you can use thinkScript to modify / create studies.
You can script something like:
(Pct wise)
plot myvar = ( (close - close[1]) / close[1] * 100);
SetChartType(ChartType.BAR);
Or
(Pts wise)
plot myvar = (close - close[1]);
SetChartType(ChartType.BAR);
More about thinkScript
Last edited:
Maybe because ROC is based on Open but if you can't chose Close as the source then I don't know ...
I don't have ToS but I see you can use thinkScript to modify / create studies.
You can script something like:
(pct wise)
plot myvar = ( (close - close[1]) / close[1] * 100)
Or
(Pts wise)
plot myvar = (close - close[1])
More about thinkScript
Thanks I will try this thinkscript.
No, it is taking the close as the source. I think it’s a scale issue.
That would be Bar Net Change which would give you the dollar amount and there is Bar Percent Change which gives you change in percentageYes I know but I need the difference between yesterday’s close and today’s close as a number. This tells me how much a stock is moving each day.
Thanks I will try this too.That would be Bar Net Change which would give you the dollar amount and there is Bar Percent Change which gives you change in percentage
%%Yes I know but I need the difference between yesterday’s close and today’s close as a number. This tells me how much a stock is moving each day.
MOST any daily candlechart shows that, dollar amount+ some do that + %.
Same way with a 2 day intraday chart\except intraday usually contains many more errors
