You are using an out of date browser. It may not display this or other websites correctly.
You should upgrade or use an alternative browser.
You should upgrade or use an alternative browser.
Chart Porn. post your chart porn.
- Thread starter grizzlybull
- Start date
What kind of nonsense is this? You'll be left in the dust with all that bullshit on your chart. The only thing you should see on chart is buy and sell signals generated by code.
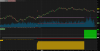
he is drawing a trendline matrix... it projects out possible turning points, the moving averages act as trend filters.
If MA indications is up and at next break of trendline off peaks, buy quantity with stop in place
If MA indications is down and at next break of trendline off troughs, sell quantity with stop in place
With that many lines price is bound to reverse from some of them simply by chance.
What's the use then?
What's the use then?
The chart prints the bamms automatically for the grizzlybull.My only question is...were your BAMM!'s printed in real time? If so, we need to chat")
With that many lines price is bound to reverse from some of them simply by chance.
What's the use then?
its all about probabilities and algo's in the market doing the same thing on the fly...
types of algo:
1) if MA indications are up only scalp on the buyside
if MA indicatioins are down only scalp on the sellside
2) if MA indications are up only scalp on the buyside with a line break.
if MA indications are down only scalp on the sellside with a line break..
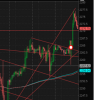
its all about decreasing the probability of stop loss being hit on 'noise' variance, those peaks and valleys in price action are the outliers where you want to enter the market.
Nah...consider me unimpressed.
Connecting lines on a chart after the fact is a piece of cake.
Connecting lines on a chart after the fact is a piece of cake.
Nah...consider me unimpressed.
Connecting lines on a chart after the fact is a piece of cake.
its visual statistical arbitrage, or a 'edge' to increase probability TP gets hit before SL.
The chart prints the bamms automatically for the grizzlybull.
fully automated..