
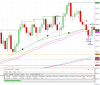
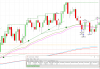
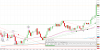
Ah, once you start adding in much more complexity, it makes it difficult to make any decisions. For me, the highs at 2843 was simply a test of the previous day high during RTH. Of course, price can easily blow through this, but its nevertheless always a level that is plotted on my chart.On the open market likes to test VwAp highs and lows, plus bond market didn’t confirm downside move, risk was it reverts and blows above 40s. It was trying to get confirmation from other markets but it never did. Thus wedge creation.
Adding also the bond market would be just so much more confirmation needed. All I watch is ES and NQ. Adding in even YM now makes things more difficult. The trouble becomes too many levels too watch. The other big thing is when the markets are out of sync, so then you question which one is right. Sometimes ES leads NQ, and other times it works in reverse.



 .
.