You are using an out of date browser. It may not display this or other websites correctly.
You should upgrade or use an alternative browser.
You should upgrade or use an alternative browser.
can price action predict market moves
- Thread starter geth03
- Start date
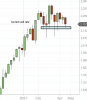
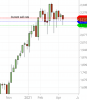
So some here would say this is just a coincidental move, as they exclude relevance of high/low/50% range of past price levels.
Reaction straight off the 50% of the range. Experience and knowledge make up the edge, the rest is risk management.
Attachments
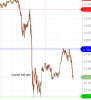
And again, purely coincidental up move!
While there are some who believe that - I don't believe I've seen anyone in particular in this thread claim that the market is random.
While there are some who believe that - I don't believe I've seen anyone in particular in this thread claim that the market is random.
I'm being sarcastic. I am a proponent of using past reaction levels as a guide of when to open up a shorter time frame chart and seeing how price reacts to these levels. It's all about skills.
There are quite a few on this board that discount TA completely, saying that past price action has no meaning when making trading decisions.
If you are entering trades and losing more than 50% of the time then your current system is worse than a random guess.
That would be true assuming an equal (random) distribution of the size of winners and losers.
Successful trading systems with a lower win rate typically have average winners which are many multiples of the average loser, i.e., risk 1 to gain 10.
In the end it's as simple as dollars gained minus dollars lost.
Systems which NEED a very high win rate are not very robust as you'll quickly end up losing money as soon as your win rate goes down.
The best is a higher win rate and high average win, but the two are usually inversely correlated. Even the famous Medallion fund have been said to have a win rate not much above 50 %.
I'm being sarcastic. I am a proponent of using past reaction levels as a guide of when to open up a shorter time frame chart and seeing how price reacts to these levels. It's all about skills.
There are quite a few on this board that discount TA completely, saying that past price action has no meaning when making trading decisions.
Sure.
Let's be clear though. There's a big difference between annotating a chart after the fact and trading the chart in real time.
In your posted chart - support held. On the swing low prior to that - support broke.
Sure.
Let's be clear though. There's a big difference between annotating a chart after the fact and trading the chart in real time.
In your posted chart - support held. On the swing low prior to that - support broke.
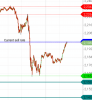
Did you not see the blue 50% range I posted before the fact? What happened after? Almost 0 pain bounce off that level. Nothing is guaranteed when it comes to trading. I'm simply saying that taking levels from the bigger charts makes total sense for retail traders as we are pretty clueless in comparison to pro traders.
Did you not see the blue 50% range I posted before the fact? What happened after? Almost 0 pain bounce off that level. Nothing is guaranteed when it comes to trading. I'm simply saying that taking levels from the bigger charts makes total sense for retail traders as we are pretty clueless in comparison to pro traders.
Yes, you posted it before the fact, but you didn't explicitly say it was a sell.
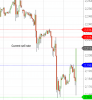
What I'm saying is that it's very easy to annotate charts after the fact compared to actually successfully trading charts day after day. That's when the rubber meets the road.
Identifying a level may be important. Knowing how to trade that level (or choose not to trade it) is more important.