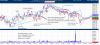
Laissez Faire is spot on of avoiding shallow trend line shorts. Way too many people use trend lines and they not done enough study on how to draw trend lines. Many draw through parts of other bars, unless they are a service that many others follow like
www.Finviz.com, myself I never draw thru them. I do use this free service, because so many others use them, and when the herd jumps on, can force the instrument to go towards a certain direction. If is like fibs and 61.8 percent retracements, of course I look at them in day trading and longer term trading, and if they make sense to me, I take them. And I usually take them as I prefer trades where you wait for price to come back.
NoDoji some years ago wrote about traps and I am sure many others have written as well, but people either don't know how to use search button as they keep making posts like these. Traps are fine for more of the advanced trader, but anyone starting out should be concerned writing a Trading Plan first just to get out of the gate. Get something going in profitable direction, monitor your losses, where they not right for overall market principles. How come few newer traders writes journals on their losing trades? Who cares what they did right, most of times in day trading if you get rid of two trades, you have a profitable day. If you risk is same as reward and you have a 5 wins-5 losses and had two less losers, you'd be 5-3, traders who concentrate on more risk management often loss less that overall community I think. Does not mean risk less and often times risk more, waves within a retracement are seldom studied, tough enough to get anyone to study Swing Lengths for low pivot low to high pivot high by the hour. study and record retracements in whatever your favorite one instrument like ES, see what the last 100 uptrend and 100 downtrend lengths are for retracements, so you get an average of how far they retrace
AND define even more by recoding where they were within the Swing, were they 2nd or the 4th retracement? Say the ES has a "mean" average of 4 points retracement on 2nd wave, so when price is at 4 point retracement and one minute is showing signs of lows.
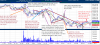
Enclosed in ES chart, it is a time I don't manually trade only because lack of volume, but I use to day trade all day long. Retracement waves are different during all 3 segments of the day session, Morning 8:30 to 10:00, Lunch 10:00 to 13:15 and Close 13:15 to 15:15 CDT, lunch usually the tightest and right now at 2 point lunch(get checked on weekends) and lunch(normal chop small bars price action) has many more than 2 retracements as they often slow in direction. SO by using 18 SMA helps much for me to quickly find deeper retracements, so I want to see where the 2 point retracement ends up and has to be on other side of the 18 SMA, as you can see by chart, circled areas show left area shows previous S/R and deeper 2 point retracements of 2 points works well. Circled areas show 2 point retracements beyond the 18 SMA, not going to be perfect all the time as volatility changes, but for tighter chop price structure, learning about wave lengths can add to one's Trading Plan.
Have a HAPPY Father Days.