You are using an out of date browser. It may not display this or other websites correctly.
You should upgrade or use an alternative browser.
You should upgrade or use an alternative browser.
BYD Cup-with-Handle Ready
- Thread starter istock
- Start date

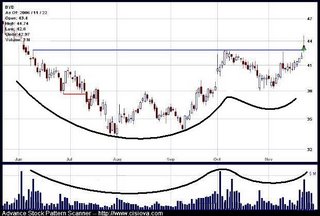
Interesting chart istock, I'm assuming your looking at the larger cup approx $43 down to $38 and back to $43. The funny thing is there's a smaller cup with a handle hidden inside the bigger one $41 to $38 to $41 with a perfect sloping handle! Is there a name for the cup within a cup pattern? Or shall we claim it? I might call it the Double C Cup Pattern. If it's alright with you.
They share a common thread of $38 so that for me would be a time to sell threshold if crossed... my buy point I'm still trying to figure out. I'm leaning towards $41.55 which scarily we might hit tomorrow. Sector is in favor though. I like the call.
They share a common thread of $38 so that for me would be a time to sell threshold if crossed... my buy point I'm still trying to figure out. I'm leaning towards $41.55 which scarily we might hit tomorrow. Sector is in favor though. I like the call.
Here's something to ponder - the big volume stick on Nov 22 was not natural. BYD was in the back of BW mag being pushed as the next take out in vegas! This brings some basic questions about analysis into play- when an outside force manipulates a chart> but that being said the stock is such a big MF'er, despite the volume it hardly moved $43.40-$44.74. So we will be buying below the takeout story. That doesn't suck. What price will it take to the downside to freak out all the folks who bought at $44 that day after picking up their Business Week? I think we're getting close... If the market straightens itself out this ought to pop like hell... I think we are 1 week away from a big purchase in BYD.

Using the Livermore Market Key I interpet BYD price behavior as a natural rally in a downward trend.
istock-
Interesting analysis and I see that some chart recognition software compliments it. One shortcoming of many of the software recognition programs is that they examine price alone when labeling a pattern. Unfortunately many individuals will grab hold of a good looking price pattern and be convinced of the certainty of a particular outcome. Recognition software is good up to a point. However, it cannot convey the nuances that a chart portends. Which, of course, is the reason we use stops.
You really canât talk in terms of absolutes when looking at a chart. One manâs falling wedge is another manâs bull flag. We all know that this is an art not a science. However, a true cup and handle pattern is a relatively rare phenomenon in the world of stocks.
You never really want to gloss over the elements of time and volume when examining a chart. The example provided satisfies 2 of the three requirements for identification of a cup and handle.
Truly the price pattern has the appearance of a cup and handle and the time frame is appropriate since it takes nearly 6 months to a year for a cup and handle to unfold.
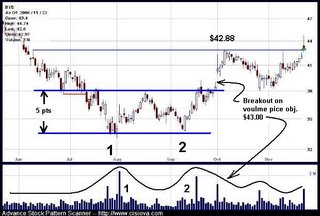
However, what is missing is the volume. For a true cup and handle the acid test is revealed in the volume. Volume will mimic the shape of the price pattern as it unfolds. A cup and handle is an accumulation pattern. You want all of the sellers out of the stock for an uptrend to unfold once a breakout occurs. Thereâs no sign at the beginning of the BYD pattern that the weak holders have relinquished their grip on the stock. You would expect a cascading of volume in the beginning of the pattern as the weak holders deliver shares during the initial shakeout as exemplified in the edited version of BYD below.
Unfortunately, this never occurs in the true chart of BYD. The pattern that you are actually looking at is a double bottom. It was completed during the first week of October with the stock reaching its forecasted initial price objective. This is confirmed once again by volume. This is a standard and quite frequent pattern that occurs more often than a true cup and handle.
It is always a good idea to take a look at a weekly chart to get an estimation of the prevailing and dominant trend. Look at BYD on a weekly chart and ask yourself, be honest now, is this a stock that you want to own?
A true cup and handle is a powerful pattern that can last up to a year in duration sometimes even two. When you are uncertain of the pattern you are looking at, take a step back, and expand the time horizon. It's truly amazing how things fall into perspective when you see the larger picture.
Next time: How to recognize take over targets through chart patterns.
thats just,
my2cents, MTA
www.mta.org
I have nothing to prove just want to elevate those around me.
Interesting analysis and I see that some chart recognition software compliments it. One shortcoming of many of the software recognition programs is that they examine price alone when labeling a pattern. Unfortunately many individuals will grab hold of a good looking price pattern and be convinced of the certainty of a particular outcome. Recognition software is good up to a point. However, it cannot convey the nuances that a chart portends. Which, of course, is the reason we use stops.
You really canât talk in terms of absolutes when looking at a chart. One manâs falling wedge is another manâs bull flag. We all know that this is an art not a science. However, a true cup and handle pattern is a relatively rare phenomenon in the world of stocks.
You never really want to gloss over the elements of time and volume when examining a chart. The example provided satisfies 2 of the three requirements for identification of a cup and handle.
Truly the price pattern has the appearance of a cup and handle and the time frame is appropriate since it takes nearly 6 months to a year for a cup and handle to unfold.
However, what is missing is the volume. For a true cup and handle the acid test is revealed in the volume. Volume will mimic the shape of the price pattern as it unfolds. A cup and handle is an accumulation pattern. You want all of the sellers out of the stock for an uptrend to unfold once a breakout occurs. Thereâs no sign at the beginning of the BYD pattern that the weak holders have relinquished their grip on the stock. You would expect a cascading of volume in the beginning of the pattern as the weak holders deliver shares during the initial shakeout as exemplified in the edited version of BYD below.
Unfortunately, this never occurs in the true chart of BYD. The pattern that you are actually looking at is a double bottom. It was completed during the first week of October with the stock reaching its forecasted initial price objective. This is confirmed once again by volume. This is a standard and quite frequent pattern that occurs more often than a true cup and handle.
It is always a good idea to take a look at a weekly chart to get an estimation of the prevailing and dominant trend. Look at BYD on a weekly chart and ask yourself, be honest now, is this a stock that you want to own?
A true cup and handle is a powerful pattern that can last up to a year in duration sometimes even two. When you are uncertain of the pattern you are looking at, take a step back, and expand the time horizon. It's truly amazing how things fall into perspective when you see the larger picture.
Next time: How to recognize take over targets through chart patterns.
thats just,
my2cents, MTA
www.mta.org
I have nothing to prove just want to elevate those around me.
2cents, that's exactly what we are waiting for I think.
You mention-Thereâs no sign at the beginning of the BYD pattern that the weak holders have relinquished their grip on the stock.
That sign of course should be at the end of the pattern not the beginnig. Those who bought at $44 will be shook out sometime soon when the stk has a $1 plus down day (with volume). My take is it will only break $41 mid day- or not at all. And then it's off to the races, especially if HET buyout heats up.