Buy The Close....Sell The Open $$$

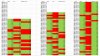
I'd fire a guy who presents me with a graph of 5 runs on the x-axis in a legend, yet plots only 3 of them, two of which are so close in color we cannot make out which is which.

@Overnight

Consider me fired from this thread, as well as your posts. Ignored.

Val
 
@Overnight

Consider me fired from this thread, as well as your posts. Ignored.

Val

Considered, and sold!

Next time you post a chart, post all x-axis plots, and with more contrasting coiors! Not everyone in your audience has a 72" 4K HD TeeVee with terapixel resolution!
 
Someone run these tests starting in the year 2000, from the year 2006, and from the year 2018 until now. Let's see the differences!

I imagine they will be startling?
 
I've been auto trading overnight edge starting beginning of the year. Some of the things that made it tradable for me include:
1) Trading a portfolio of over a dozen of low correlation ETFs, ie TQQQ to JNUG only 0.04 correlation, all instruments do not move/gap in the same direction.
2) Mostly 3x leveraged ETFs, to magnify the edge. Close to open SPY since inception in 1993 would result in 0.03% pl, assuming no commission, too little to bother with, but still better than 0.004% pl for open to open. Close to open JNUG since inception in 2013 would result in 0.33% pl, worthy of further investigation.
3) Only take the highest probability (and much lower standard deviation) trades, as opposed to every close to every open. I spent few months backtesting filters that have me take only some 33% of the signals, so every 3rd close to open on average. I skip most overnight edge signals when market volatility increases, markets get too overbought or oversold, or the ETF itself goes to extremes. This would keep me almost fully in cash most of March 2020. My OE filtered model maximum drawdown is a crazy low -3%, whereas if I took all the signals I'd be down as much as -49%. My worst single trade so far has been -21%, while unfiltered there would be trades as bad as -80%.
4) Very low to no costs. Mostly trading in tax advantaged (IRA) accounts with $0 commission brokers (most US brokers starting in Oct 2019), taking advantage of the closing and opening crosses (no slippage).
5) Very low correlation to my other trading models (mainly mean reversion) and the markets (my OE model to SPY has 0.11 correlation).

 
Backtesting software - RealTest.
Since it's so easy to do I ran a comparison with 20 MA.

Val

Nice! Was this "Buy the Close - Sell the Open" when the market is (closing) above the 20MA?

Your SPX_CO graph looks quite similar to the one I posted for 2020. Terrible drawdown.
 
If you did this in 2020 - you'd be up 79 ES points excluding commissions and assuming you'd actually get filled on the Close/Open. You'd have to endure a 808,75 point drawdown. That's more than 40K on 1 ES contract.

A quick study, so I'll stand corrected if there's anything wrong.

View attachment 240334

Ironically, I did a similar study earlier this year on Nasdaq if buying the open (9:30am) after (previous day) a down day and selling at close (4pm). This year so far that strategy would result in a 4000 pts ($80k) profit with a maximum drawdown of 550 pts ($11k).
 
Last edited:
Someone run these tests starting in the year 2000, from the year 2006, and from the year 2018 until now. Let's see the differences!

I imagine they will be startling?

Overnight edge has been present in most equity markets. Here's a simple test I did to show Night (every close to next open) vs Day (every open to close) p&l per year in American, German, and Japanese markets. Yes, US overnight edge seems to have decreased from the 1990's in the SPY/SP500, but is quite persistent in the Nikkei.
 

Attachments

  • OE-PerYear-Major-Markets.jpg
    OE-PerYear-Major-Markets.jpg
    398.7 KB · Views: 26
Last edited:
Back
Top