
You are using an out of date browser. It may not display this or other websites correctly.
You should upgrade or use an alternative browser.
You should upgrade or use an alternative browser.
BREAKING NEWS: First the triangle broke, now the support broke
- Thread starter joezapp
- Start date
Maverick...
a) I'm implying that the market could be in correction mode.
b) If you've been paying attention, there was to be a sharp break at the end of the triangle. The sharp break has confirmed to be down now that the triangle has ended.
c) If shorting the market is what my trading thesis is, you'd be correct. I'm a long investor. Happy to sell my bear ETFs and focus on my next long entry point, again, with my raised cash.
d) I'm implying that the bottom can reverse very quickly, like the Brexit bottom. I have in no way recommended anyone get short here. The exciting move, when it happens, will be up. That's my view. I'm a long-term bull. You can trade however you want.
e) I'd love to have a long entry point at a 10% S&P correction. I DID NOT say that is my expectation. The fact that I'd like to SEE it does not make it my expectation.
Why don't you finally contribute something? You've yet to display that you are in any way a trader.
Yeah dude, I've been posting for 14 years. I'm just buying time waiting to make my first constructive post. I'll be sure to post a "Breaking News" thread the second I do.
Let me ask you an honest question. Do you feel your "thread title" was appropriate given this "new" information you have posted. I mean, you could have posted to any one of the existing 500 threads that are all calling for a market top. Yet you start a new thread. Fine, you could have simply started a new thread asking a rhetorical question, has the market broken down and brought on your evidence. No, you didn't do that. You start a thread with the title:
BREAKING NEWS: First the triangle broke, now the support broke
You even put breaking news in all caps to draw attention to yourself. Then to top all that off you proclaim that "after" posting that very headline (on the market lows I might add), you then come here to proclaim you covered your shorts and you're really a long term bull that simply "would like" the market to go down.
Please do us all a favor. If tomorrow the spoos are down 60, don't come back on here saying you are magically short again and that this is the "real breakdown" you were looking for.
I agree. DOW didn't want to stay below 18000 for too long. It was the longest time it spent below since the post-Brexit breakout, though. Tomorrow will be interesting!I wouldn't get too excited yet, it feels like another wait and see day. While the gap down wasn't pretty, the rest of the day was a steady climb upwards. See if earnings continue to disappoint.
That was indeed BREAKING NEWS. Others on here got it.Yeah dude, I've been posting for 14 years. I'm just buying time waiting to make my first constructive post. I'll be sure to post a "Breaking News" thread the second I do.
Let me ask you an honest question. Do you feel your "thread title" was appropriate given this "new" information you have posted. I mean, you could have posted to any one of the existing 500 threads that are all calling for a market top. Yet you start a new thread. Fine, you could have simply started a new thread asking a rhetorical question, has the market broken down and brought on your evidence. No, you didn't do that. You start a thread with the title:
BREAKING NEWS: First the triangle broke, now the support broke
You even put breaking news in all caps to draw attention to yourself. Then to top all that off you proclaim that "after" posting that very headline (on the market lows I might add), you then come here to proclaim you covered your shorts and you're really a long term bull that simply "would like" the market to go down.
Please do us all a favor. If tomorrow the spoos are down 60, don't come back on here saying you are magically short again and that this is the "real breakdown" you were looking for.
The most recent "market top" happened mid-August. That's very old news.
Why wouldn't a long with cash to put to work NOT be interested in this thread? Or not be interested in a correction? While some traders like to jump on the momentum when support or resistance breaks and trade in that direction, that's not how I play, and many don't play that way. I, like many, am an investor first and a trader second. Again, you assumed that I was implying "support broke, go short now!". Never said that, wasn't implying that. I'm implying that this may be a corrective phase. I'm also certain that I don't know if we've bottomed or not. Hence, the timely discussion about it.
For the record, I last shorted the market briefly (and correctly) pre-Brexit, I did it again in mid-August (correctly), I am currently NOT short the market, and I WILL NOT short the market again until mid-2017 at the earliest. You can put that on my record. But, again, shorting the market is not the topic. Discussing the market's next moves based on what happened this week, the "breaking news", IS the topic. And not really from a fundamental perspective. More from a technical and charting perspective, as some here have already contributed.
Last edited:

The 'triangle' to which the OP refers is not IM(not so)HO a triangle.
The triangle pattern seems to be the most misread of all patterns. Anywhere that two converging lines can be drawn automatically becomes a triangle to some, such as in this article.
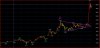
Chart patterns begin with an end to a move in the primary or counter trend direction. In the case of a triangle that would be at point A in the attached chart. The OP's starting point of Sept.7th is just a line attached to an irrelevant move within the range that started way back in mid-July. Additionally, a triangle being what it is must have a move to reverse or continue. So its initial point cannot be a congestion as the OP sees it.
I imagine this is the article the OP read before starting another thread on the subject the same day. http://www.marketwatch.com/story/sp...arns-of-a-big-selloff-analyst-says-2016-10-10.The triangle that started September 7 in the S&P has been a subject of frequent conversation in the financial media.
The triangle pattern seems to be the most misread of all patterns. Anywhere that two converging lines can be drawn automatically becomes a triangle to some, such as in this article.
Chart patterns begin with an end to a move in the primary or counter trend direction. In the case of a triangle that would be at point A in the attached chart. The OP's starting point of Sept.7th is just a line attached to an irrelevant move within the range that started way back in mid-July. Additionally, a triangle being what it is must have a move to reverse or continue. So its initial point cannot be a congestion as the OP sees it.
Attachments
Last edited:
Thanks for the input. Everyone charts differently and interprets what they see differently. I saw this version of triangle clearly developing the second half of September. I started searching the net for articles written by those who saw the same thing. There were a few blogs, but none of the financial sites had anything yet. As the triangle was nearing it's end, the article you refer to popped up on Marketwatch. Can't deny that technical analyst Worth nailed it. As I said previous, I knew there would be a sharp breakout, and I suspected in the down direction only because of seasonality and the election. But I know these sharp triangle breakouts can go either way. Nice to see someone predict the direction as well and get it right. Some of these technical analysts have the market sized up really well.The 'triangle' to which the OP refers is not IM(not so)HO a triangle.
I imagine this is the article the OP read before starting another thread on the subject the same day. http://www.marketwatch.com/story/sp...arns-of-a-big-selloff-analyst-says-2016-10-10.
The triangle pattern seems to be the most misread of all patterns. Anywhere that two converging lines can be drawn automatically becomes a triangle to some, such as in this article.
Chart patterns begin with an end to a move in the primary or counter trend direction. In the case of a triangle that would be at point A in the attached chart. The OP's starting point of Sept.7th is just a line attached to an irrelevant move within the range that started way back in mid-July. Additionally, a triangle being what it is must have a move to reverse or continue. So its initial point cannot be a congestion as the OP sees it.

LOL, site owner requests a chart to clarify what your are referring to and you tell him to pull up a chart and plot it himself???Hi Baron. Thanks for founding this site. The triangle that started September 7 in the S&P has been a subject of frequent conversation in the financial media. Didn't know I needed to prove it on ET, of all places? Simply pull up the S&P 3-month chart and you'll see it clearly. Thanks...
Epitome of laziness - Nothing surprises me on ET any longer...
LOL, site owner requests a chart to clarify what your are referring to and you tell him to pull up a chart and plot it himself???
Epitome of laziness - Nothing surprises me on ET any longer...
Especially since his last post on this thread is "Everyone charts differently and interprets what they see differently"
Laziness of the founder, or out-of-touch, likely both. And you need to find something better to do than waste a post here.LOL, site owner requests a chart to clarify what your are referring to and you tell him to pull up a chart and plot it himself???
Epitome of laziness - Nothing surprises me on ET any longer...
Last edited:
This version was well-known and obvious. Sorry I don't have time to waste for those uninformed. Also sorry for those who can't pull up a simple 3-month S&P chart. That's all it takes. Clear as day.Especially since his last post on this thread is "Everyone charts differently and interprets what they see differently"