You are using an out of date browser. It may not display this or other websites correctly.
You should upgrade or use an alternative browser.
You should upgrade or use an alternative browser.
boru's price action journal
- Thread starter boru
- Start date

Too much over-analysis here. Looking at your chart, there was one trade that could be held all the way through with a small stop loss.these notes are unedited and show how I saw price trading today. I am making an effort to see only movement not entries .
9:28 premarket thrust to ovh
9:30 rejected
9:32 price BO above ovh 64?
9:34 RET? price using ovh as S
9:36 seems reluctant to go up overlapping bars back to ovh
9:37 RET? poking below ovh
9:39 grinding upward ovh acting as S if I were forced to take a position I'd go long lets see what the market teaches me
9:41 lol price drops below ovh 55.50?
9:42 price trades below 55.50 and closes below 55.50 am trying to pay attn. to how price acts at s/r poking above/below, how much, closing above/below, speed ...
9:43 watching the right tick price climbs the 9:42 bar the trades back down gamera mentioned this behavior in his post you can see this on a smaller bar interval but every time I do that I screw it up
9:44 price trades below ovl 48?
9:47 pace is slowing price seems to want to rest and rejection?
9:50 trading up to ovl
9:53 above ovl SL break
9:54 ret and higher prices
9:58 price trades thru 55.50 and in a hurry to the ovh I have a note replay 9:57 bar
10:01 above ovh back to 62.25 64?
10:05 price cant stay above ovh drops to 55.50 congestion
10:12 thought higher prices were coming then bottom dropped out back to ovl 48?
10:18 trades back to 55.50 rejected RET higher prices ?
10:25 hinge? price is moving highr ovh will tell
10:30 rejection at ovh?
10:35 price pulls back testing ovh not sure if I would have been trading this, would have 3 months ago recognizing it for what it is I'm learning its best to just sit sometimes
10:36 price couldn't trade back to 61.25 highs failure and a drop to 55.50 ( popular today)
10:37 does it mean anything if the pa in a hinge is tilted to one side? is there a tell here?
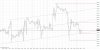
11:00 price trades in a tight range between 55.50-61 done for the dayView attachment 149829
I think you're right, there are certain areas of S/R I want to trade, but how price gets to those areas is important too. thanksToo much over-analysis here. Looking at your chart, there was one trade that could be held all the way through with a small stop loss.
thanks going off in the weeds againBeware of virgins and volcanos.
1. price opened near MP and traded in range until BO at 9:50
2.RET at 10::00 trading higher to DT at 64 trading in a range until BO to the downside at 11:00
3.we have two TRs straddling the OVH looks to be a day to seek balance price trades down to OVL at 43
4.buyers come in trading price back up toward the MP and OVH where buyers refuse to pay higher prices and..
5. price trades down to 33 the bottom of the 60 min TR from the last few days
6. price trades off the 33 level and back to the OVH forming a hinge around 51 the MP of the last larger range.
there were trades out there today, I am getting more comfortable watching a 5 and even 15 min bars, understanding its not the bar itself, just a representation. a larger bar interval gives me a bigger view on behavior in the past that would have been out of sight to me with a smaller bar interval
yes, if you're watching a 5 min you have to unless you keep a smaller chart open in the corner of your screen, thanksAnd you can always trade off the right tick.

