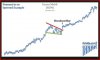
I think that what you are seeing is an important lesson. Sometimes the trade works, and sometimes it doesn't. The first one is rather large, while the 2nd and 3rd are much smaller, so these may be fundamentally somewhat different enough to different traders trading different time frames.
But you have correctly noticed a certain phenomenon. In the first two cases, the level of support that was forming continued to be support, since price couldn't break through, and the diagonal down slopping trendline of the pennant that tracked the lower highs broke. Obviously as the pennant forms, either the support level will break, and price goes down, or the down trendline will break as price busts through.
What jumps out for me right away though was if you look at the highs around 239, you've got 3 tops, hence a triple top. So in my opinion, it wasn't so much about the 3rd pennant that worked and price broke out the bottom, what is more important is that the high around 239 couldn't be taken out, so going down was the logical new direction. The fact that the pennant broke this time is inconsequential.
So I think that if you are studying pennants, you will see that some work, and some don't, but if you try and find what is different about them, the context, this will make a huge difference. The next trick of course is figuring out where you want to be a buyer or a seller.