You are using an out of date browser. It may not display this or other websites correctly.
You should upgrade or use an alternative browser.
You should upgrade or use an alternative browser.
Backtesting ideas?
- Thread starter nxt7
- Start date
Find a Historic data provider and test against NBBO quotes versus Trade prints. (IQFeed or DTN NxCore are both decent). Trade Prints have too many gaps - NBBO changes better reflect market price action . Test at 1 second bars using the low bid and high ask as RegNMS allows orders to be filled at the worst bid or offer over the preceeding second.
If your strategy uses trailing stops or any exchange managed orders using quote data will more accurately identify fills. ie. quoted through your target = fill.
If you are using ISO orders than Level II data may be used to estimate fills.
If your playing rebates than test using the exchange proprietary feed against NBBO.
I've done the usual backtesting like trying to find historical average returns for each week, month, year and also some candlesticks. Does anyone have anymore ideas for backtesting I can experiment around with?
Are you backtesting with real ticks? You can download real ticks with softwares like Tick Story
By default Metatrader simulate ticks from M1 candles.
By default Metatrader simulate ticks from M1 candles.
You can check to see if 'sell in May; and go away' or 'as January goes; so goes the year' are still valid.
You can also check for holiday correlations, day-of-the-month correlations, day-of-the-week correlations, lunar correlations, etc.
You can also test to see what year in the past, this year, so far, matches best; or which past April best matches this April.
Please post your findings.
You can also check for holiday correlations, day-of-the-month correlations, day-of-the-week correlations, lunar correlations, etc.
You can also test to see what year in the past, this year, so far, matches best; or which past April best matches this April.
Please post your findings.
IMO: Backtesting is a highly fragmented and severely porous field. First, one needs to ask themselves the honest and specific/detailed question: What exactly, do I need/want?
IMHO: This question is a very difficult to derive, as each of us have very different goals/requirements.
IMHO: This question is a very difficult to derive, as each of us have very different goals/requirements.
You can check to see if 'sell in May; and go away' or 'as January goes; so goes the year' are still valid.
You can also check for holiday correlations, day-of-the-month correlations, day-of-the-week correlations, lunar correlations, etc.
You can also test to see what year in the past, this year, so far, matches best; or which past April best matches this April.
Please post your findings.
Buying Large cap or Small cap value Nov - Apr and replacing with Large cap "dividend growth" / Utilities sector / cash May - Oct is one way to exploit the "anomaly" and has produced consistent alpha premium over a 50 year sample https://docs.google.com/document/d/1XxnEl6aAsU56Afkp_lXAKb8xGWq65wiY8iw3RGTtyuU/edit?usp=sharing
James
Director, Quantitative research
XXX
Boulder, CO
"money is made by sitting on one's hands"
The possibilities are endless. All I can recommend is that you become data driven so any patterns you consider viable can be mathematized and quantified. You really need to study the expansion/contraction (generally event driven) cycles to build something worthwhile
You don't really need to "back test" anything because so many people before you have back tested and written about their results. But if it will give you piece of mind, I guess it's worth it.
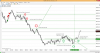
I know you're confused by the lines I draw on my charts, so I'll add some words this time. Here is my back tested method that has worked for hundreds of years, on any time frame, any instrument, and will always work. No back testing needed (I apologize to those whose edge I will ruin).
See below:
I know you're confused by the lines I draw on my charts, so I'll add some words this time. Here is my back tested method that has worked for hundreds of years, on any time frame, any instrument, and will always work. No back testing needed (I apologize to those whose edge I will ruin).
See below: