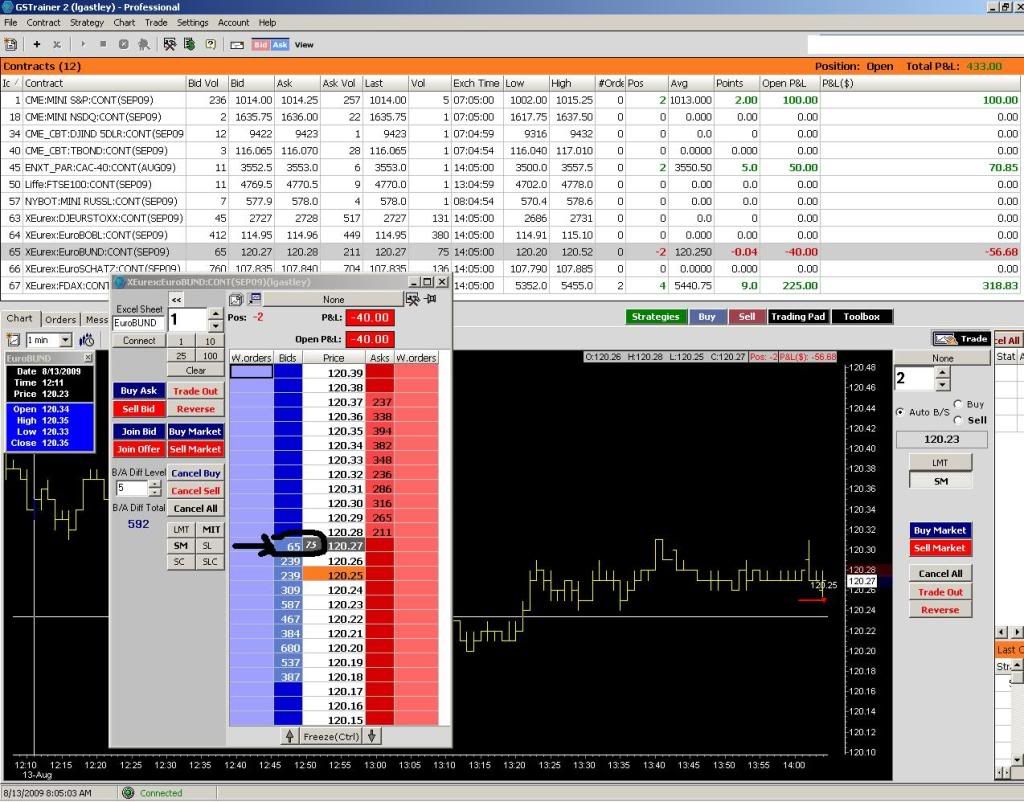
[b]QUICK QUESTION [/b]

Quote from flyingdutchmen:

you are looking at the orderbook those are contracts

only place to find individual trades are in a tickchart

Are those contracts that are "waiting to be executed" or number of contracts that have were hit at that price level

And I see that those numbers are listed on the bid and ask volume
 
Quote from lloydgastley:

Are those contracts that are "waiting to be executed" or number of contracts that have were hit at that price level

And I see that those numbers are listed on the bid and ask volume

The numbers on the right and left respectively are orders in queue for that price, bid and offer. As stated above lots of games go down and those numbers are mostly a crock of shit.

The number right next to the price is the actual number of contracts traded at said price.
 
Quote from the1:

and for your other question marks....the numbers above and below the 34 in blue and red is the depth of the market. Those are the orders that are sitting at that price. For example, the 494 below the 34 represents 494 contracts that are waiting to be bought at 1005.75. It's important to note that these numbers are mostly bullshit and completely worthless. The market will trade thru these price levels and you can bet your bottom dollar next to none of those contracts will actually execute. There's lots of games being played on market depth. It changes to quickly for it to be of any use to the human eye. A computer may be able to do something with it but I doubt that too.

The B/A Diff Total is the difference between the quantity bid vs offered at a certain number of price depths. On your example you have 5 so the B/A differential is -69 on 5 levels, or down to 1004.75 and up to 1007.00. Again, since market depth is of no use then this number is of no use. IMO...the only thing the order pad is good for is entering orders.

Thank you....why then those numbers do not get executed when it hits that particular price? If 34 contracts were executed out of 311, what happen to the rest?
 
Quote from spd:

The numbers on the right and left respectively are orders in queue for that price, bid and offer. As stated above lots of games go down and those numbers are mostly a crock of shit.

The number right next to the price is the actual number of contracts traded at said price.

But help me here....those numbers are placed by "traders"..you? or by whom then if those numbers are worthless?
 
It looks like you are using PA on a one minute chart. You also have the Depth of Market showing.

The DOM part of your post is stated in contracts and prices only.

Below is an old snagit of a moment in trading. What you see is an executed trade, just past, and the snagit of the trade for debriefing purposes.

The trade was decided upon in 4 of the six steps mentioned. The DOM is very important as part of this process.

On it you can see all the games being played and just how each of the principal playing strategies are working. In this way the trade "comes into view" well ahead of time.

To have a distinct advantage in trading it is a good idea to add scripts or snippets to your display so you are not in the dark.

Presently you cannot "read the tape" by reading the DOM or the T and S. Google all terms that are unfamiliar to you and print out what you find so you can read it enough times for it to sink in. Annotate the prints of the pages as well as you learm more and more about what you are reading.

As you see the "long" is announced by the snippet that shows the "smart money's" intentions and actions. The "tell" is the group of 15 second bars that are near "1".

At 2 you find the "bottom" price that will occur on the "turn". The stalagtite snippet display the DOM numbers as bar lengths in various shades of blue. Immediately, you kinow how many ticks there are to the "best" price on the turn.

I may have to do 8 partial fills to get the turn and my skill is such that they are 2 to 3 seconds apart. So I need to know when to execute the series of orders (Market) so get the best price.

The pink vertical line is the trade. After the trade you see the price moving to give me the first profits.

As you see the DOM orders at the "turn" are largely unfilled because there were so many on the order book.

You can notice on the two tick charts that one chart leads the other. This is nice to have as a leading indicator of what you are trading. It gives you a confirmation of the traded instrument (ES) before the ES comes to the time for the "turn".

So the chart I posted have "three" leading "tells" that preceed getting the "turn" "carved" right to the best tick:

1. the smart money decides and acts.

2. the "dumb money" limit orders form a "wal" too big for price to go through and they also miss the trade and go into a loss condition right after where they "freeze" to the benefit of smarter traders.

3. The YM tick chart "leads" the ES tick chart through the turn.

4. The declining volume of the turn before the "bottom" is "black" volume; and right after the "best price" the "black" volume is increasing. Confirming the trade.

5. The word HOLD is used to describe what is done to make money. Coming iot the turn a "short" HOLD was in place. On the "turn " a reversal is done using partial fills according to the maximum size on the T and S. You cannot execute more contracts at market than the capacity ofthe market, so you just keep filling with partials until you have completed the turn.

Unfortunately, because I posted your poorly moderated thread will be foulded up. But I do hope this post has been informative for your benefit.

To the moderator: I've had it with your fucking detracting and fucking up threads comments. Apoligize, as soon as you read this post.


attachment.php
 

Attachments

Quote from jack hershey:

It looks like you are using PA on a one minute chart. You also have the Depth of Market showing.

The DOM part of your post is stated in contracts and prices only.

Below is an old snagit of a moment in trading. What you see is an executed trade, just past, and the snagit of the trade for debriefing purposes.

The trade was decided upon in 4 of the six steps mentioned. The DOM is very important as part of this process.

On it you can see all the games being played and just how each of the principal playing strategies are working. In this way the trade "comes into view" well ahead of time.

To have a distinct advantage in trading it is a good idea to add scripts or snippets to your display so you are not in the dark.

Presently you cannot "read the tape" by reading the DOM or the T and S. Google all terms that are unfamiliar to you and print out what you find so you can read it enough times for it to sink in. Annotate the prints of the pages as well as you learm more and more about what you are reading.

As you see the "long" is announced by the snippet that shows the "smart money's" intentions and actions. The "tell" is the group of 15 second bars that are near "1".

At 2 you find the "bottom" price that will occur on the "turn". The stalagtite snippet display the DOM numbers as bar lengths in various shades of blue. Immediately, you kinow how many ticks there are to the "best" price on the turn.

I may have to do 8 partial fills to get the turn and my skill is such that they are 2 to 3 seconds apart. So I need to know when to execute the series of orders (Market) so get the best price.

The pink vertical line is the trade. After the trade you see the price moving to give me the first profits.

As you see the DOM orders at the "turn" are largely unfilled because there were so many on the order book.

You can notice on the two tick charts that one chart leads the other. This is nice to have as a leading indicator of what you are trading. It gives you a confirmation of the traded instrument (ES) before the ES comes to the time for the "turn".

So the chart I posted have "three" leading "tells" that preceed getting the "turn" "carved" right to the best tick:

1. the smart money decides and acts.

2. the "dumb money" limit orders form a "wal" too big for price to go through and they also miss the trade and go into a loss condition right after where they "freeze" to the benefit of smarter traders.

3. The YM tick chart "leads" the ES tick chart through the turn.

4. The declining volume of the turn before the "bottom" is "black" volume; and right after the "best price" the "black" volume is increasing. Confirming the trade.

5. The word HOLD is used to describe what is done to make money. Coming iot the turn a "short" HOLD was in place. On the "turn " a reversal is done using partial fills according to the maximum size on the T and S. You cannot execute more contracts at market than the capacity ofthe market, so you just keep filling with partials until you have completed the turn.


Thanks very much for this.

So the smart money does not show on DOM. But is visible (past tense) on T/S.

Would you elaborate on the "games"? What does one look for to see them being played? Is this orders being placed and pulled (not executed) on DOM? Are these "games" in effect during cascades?

Thanks again.
 
The 311 are still the contracts remaining in the queue. Futures trading is first-come, first-serve so some contracts will get executed even if the price does not trade through. If the price trades through a certain number then ALL contracts sitting on that number will be executed. Watch this tomorrow and you'll notice that something like 1000 lots will be sitting at some price, the market will trade thru that price, but 1000 lots will not show up in the volume or the Time and Sales. These numbers are mostly BS and not worth watching. The answers are in the charts.

Quote from lloydgastley:

Thank you....why then those numbers do not get executed when it hits that particular price? If 34 contracts were executed out of 311, what happen to the rest?
 
Quote from the1:

The 311 are still the contracts remaining in the queue. Futures trading is first-come, first-serve so some contracts will get executed even if the price does not trade through. If the price trades through a certain number then ALL contracts sitting on that number will be executed. Watch this tomorrow and you'll notice that something like 1000 lots will be sitting at some price, the market will trade thru that price, but 1000 lots will not show up in the volume or the Time and Sales. These numbers are mostly BS and not worth watching. The answers are in the charts.

ok, thanks...but again those 1000 contracts is that "you"...real contracts siting there? or is the 1000 not real, some imaginary bs number sitting there? help me here :confused:
 
How could so many contracts trade when the "sitting" contracts were smaller...I just don't get it...but like you guys said then those numbers are all BS

untitled-1.jpg
 
Back
Top