
At which of these previous S/R levels is the S&P most likely to reverse?

Where is the S&P likely to reverse?

  • A

    Votes: 1 20.0%
  • B

    Votes: 0 0.0%
  • C

    Votes: 0 0.0%
  • D

    Votes: 1 20.0%
  • E

    Votes: 0 0.0%
  • F

    Votes: 0 0.0%
  • G

    Votes: 0 0.0%
  • H

    Votes: 1 20.0%
  • I

    Votes: 0 0.0%
  • J

    Votes: 1 20.0%
  • K

    Votes: 0 0.0%
  • L

    Votes: 0 0.0%
  • M

    Votes: 0 0.0%
  • N

    Votes: 0 0.0%
  • O

    Votes: 0 0.0%
  • P

    Votes: 0 0.0%
  • Q

    Votes: 0 0.0%
  • R

    Votes: 0 0.0%
  • all equally likely

    Votes: 0 0.0%
  • It's going to reverse at a place you didn't draw because you don't know how to draw S/R points

    Votes: 1 20.0%

  • Total voters
    5
edit - I thought there was an option to allow multiple poll choices but I guess not. I wanted people to be able to vote for the places they thought were the most likely reversal points but since the poll only allows you to vote for one it's going to be pretty hard to pick. So instead lets use this thread for BS-free discussion about why price is more likely to reverse at certain previous S/R points than others, or why it is more likely to reverse at levels that were not previous S/R points.


Green = previous S level
Red = previous R level
Blue = previous S and R level

Daily S/R levels:
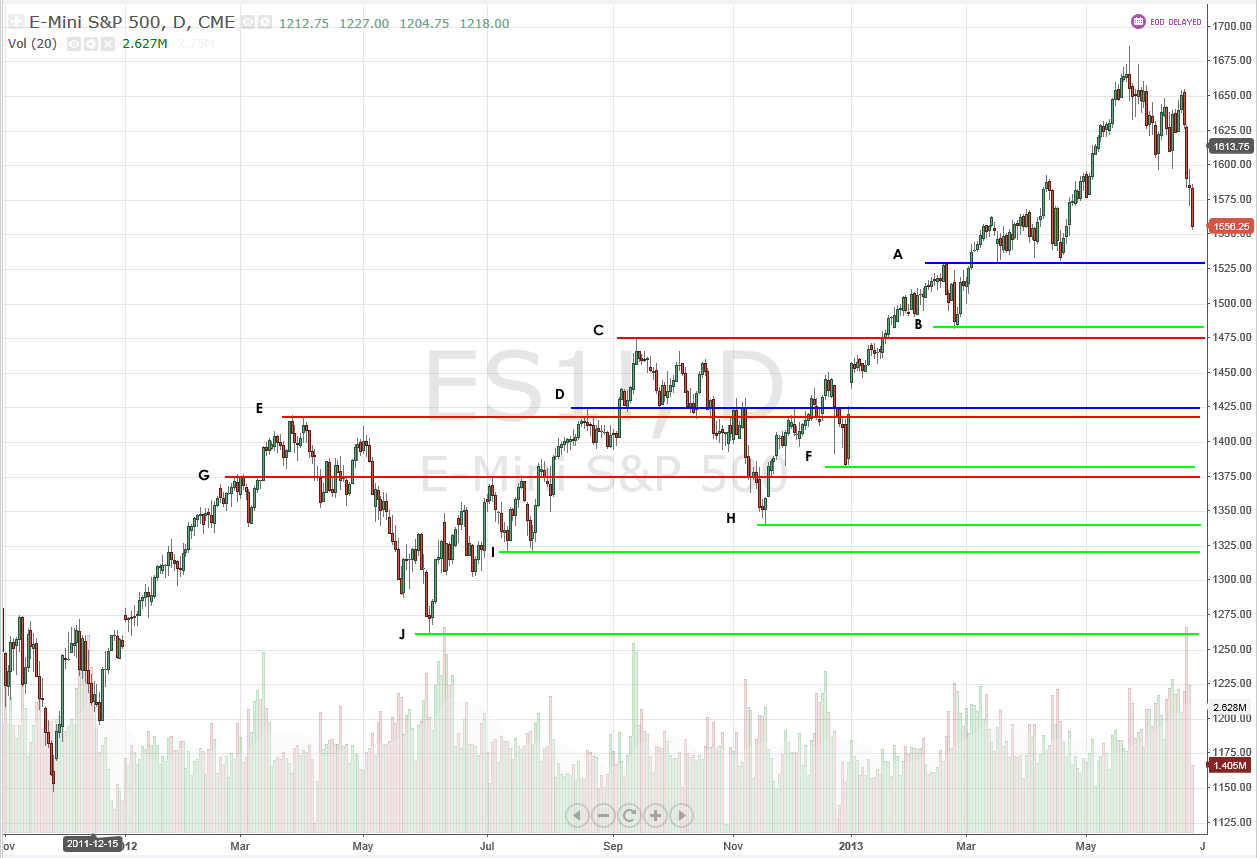
SP-previous-daily-S-R-levels.png


Weekly S/R levels:

SP-previous-weekly-S-R-levels.png
 
Quote from Lord.Maushi:

For what is worth, you marked none of the high probability horizontal ones.

Sorry.

Can you help me understand which ones are high probability and why?
 
Back
Top