Are all price patterns the same? (examples)

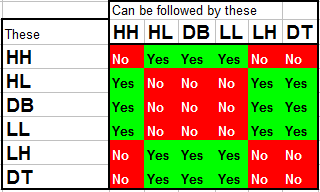
Quote from Chris_Anonymous:

It seems to me that the next step is to find a pattern of HHs and HLs or LLs and LHs and then writing up some rules around that. If you have 6 different market events (HH, HL, LL, LH, DB, DT), then figure out what combination of those events more often than not leads to a significant price move.

From my limited experience, that's your signal, and then the actual 'edge' comes from more rules for risk/money management and so on.

Think in terms of Sequences...
 
Quote from achilles28:

You're actually very close. How do you define trend?

I don't really define trends.

I've seen people say a trend is two HHs and HLs.

Or a low, HH, HL, HH.

Or an HH, HL, HH.

I've seen plenty of LLs follow HHs.

...and then make another HH.

I don't know where the trend is then.

But I've also seen some textbook HH HL HH HL trends that keep going.

I've seen people say the trend is defined by the slope of a moving average. In this case, your trend depends on the period of the MA. A 200 period average may get you a different answer than a 50 period average.

I've seen people say a trend is when R flips to S.

All of these seem like they work great sometimes.

That's my answer. If you can help me out with specifics I would appreciate it.
 
Quote from 1a2b3cppp:


I've seen plenty of LLs follow HHs.

...and then make another HH.

Try examining if the so called LL in an uptrend actually did a LL close, that would help you filter out a lot of the pseudo LLs in uptrends.
 
Quote from 1a2b3cppp:

I don't really define trends.

I've seen people say a trend is two HHs and HLs.

Or a low, HH, HL, HH.

Or an HH, HL, HH.

I've seen plenty of LLs follow HHs.

...and then make another HH.

I don't know where the trend is then.

But I've also seen some textbook HH HL HH HL trends that keep going.

I've seen people say the trend is defined by the slope of a moving average. In this case, your trend depends on the period of the MA. A 200 period average may get you a different answer than a 50 period average.

I've seen people say a trend is when R flips to S.

All of these seem like they work great sometimes.

That's my answer. If you can help me out with specifics I would appreciate it.

These are Held Pivots versus Failed Pivots. Also informative. If you can't discern Direction then do not participate.
 
First incorrect hypothesis;

Assuming reading PA is about patterns – it isn’t

==========================================

PA is about behavior… intent… emotion

PA is about effort exerted, and the resulting price movement


PA (behavior to a lesser extent – but especially intent) runs 2, at times 3 - layers deep

Patterns are simply the result of behavior, emotion, intent


Smart traders don’t trade patterns – they exploit them

===========================================

Second incorrect hypothesis

Price can only do 6 things - (and I will leave this to you to figure out if I'm full of shit stating so)


RN
 
https://en.wikipedia.org/wiki/Paradigm_shift

"Kuhn used the duck-rabbit optical illusion to demonstrate the way in which a paradigm shift could cause one to see the same information in an entirely different way.
"

https://www.google.com/search?q=par...oF87KkQWkkoCQCg&ved=0CEkQsAQ&biw=1024&bih=472

:D

Quote from Redneck:

First incorrect hypothesis;

Assuming reading PA is about patterns – it isn’t

==========================================

PA is about behavior… intent… emotion

PA is about effort exerted, and the resulting price movement


PA (behavior to a lesser extent – but especially intent) runs 2, at times 3 - layers deep

Patterns are simply the result of behavior, emotion, intent


Smart traders don’t trade patterns – they exploit them

===========================================

Second incorrect hypothesis

Price can only do 6 things - (and I will leave this to you to figure out if I'm full of shit stating so)


RN

PA conveys Effects and should be observed accordingly. A Fractal may do many things at once.
 
Quote from Redneck:

Second incorrect hypothesis

Price can only do 6 things - (and I will leave this to you to figure out if I'm full of shit stating so)

Well technically it can also go sideways making neither highs nor lows, so it can really do 7 things. But that barely ever happens so I didn't mention it.

And then you've got the activity between highs and lows in which can it is uncertain what price is doing. For example, if price just made a higher high and is now retracing, the only possible things it can do is make a higher low, a double bottom, or a lower low, and until it starts going back up it can't be certain which it's going to do.

high-low-table.png
 
Back
Top