anyone have any intraday es spy nq qqq charts from 2000?

1 min 5 min 15 min time frames ? just post em here if you do looking mainly for indexes intraday but any stock is good i had tons of them in old school screen shots from essignal almost everyday and i lost them from a bad hard drive.

it is good to see what happens in the bubbles
 
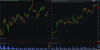
Here you go - AMZN 8-31-1999 5 minute chart left side. APTR is the average price range over 10 bars (50 mins).

The average price range in percentage over 1-5 minute bars from 1999 to present has been nearly identical. Not just now but over the last few years or more.
 

Attachments

  • upload_2020-8-31_12-24-6.png
    upload_2020-8-31_12-24-6.png
    155.5 KB · Views: 48
Last edited:
Here you go - AMZN 8-31-1999 5 minute chart left side. APTR is the average price range over 10 bars (50 mins).

The average price range over 1-5 minute bars from 1999 to present has been nearly identical - not just now but for years.

Source: Tradestation
View attachment 238394

Oh gawd, I hate you Mr. Gumby. Those 1999 charts make me ill.

 
Oh gawd, I hate you Mr. Gumby. Those 1999 charts make me ill.


You & me both. In 2000 my CPA asked me why I traded Amazon so much - I went on & on explaining their disruptive business model & all that. I'll never forget what my CPA said:

"Your going to feel really dumb when your older if that stock does half as good as you think & you don't own any shares. Why not just buy a small stake with say 10% of your capital & hold on to it until you retire? "

Those words still haunt me since he really tried to break through my silly day trading mentality.
 
Last edited:
Here you go - AMZN 8-31-1999 5 minute chart left side. APTR is the average price range over 10 bars (50 mins).

The average price range in percentage over 1-5 minute bars from 1999 to present has been nearly identical. Not just now but over the last few years or more.
thanks great
 
1 min 5 min 15 min time frames ? just post em here if you do looking mainly for indexes intraday but any stock is good i had tons of them in old school screen shots from essignal almost everyday and i lost them from a bad hard drive.

it is good to see what happens in the bubbles
%%
I have a 30 minute QQQ 5 day paper color candlechart chart,may 2002.
Picture a 5 day qqq move mostly down + rocket up 10% in one day /priced around $30-33.
End of bear move/bear market more or less. Volume average, 100 million /day, better than this year...………………………………………………………………………………………………………………………………………………….
 
Back
Top