Any idea?

You are using an out of date browser. It may not display this or other websites correctly.
You should upgrade or use an alternative browser.
You should upgrade or use an alternative browser.
Any good Order Flow Trading Strategy book suggestion?
- Thread starter GloriaBrown
- Start date
Very tough to learn, happens in seconds and gone, matter of watching and not reading material. Years of watching you might come up with a few maybe repeatable patterns. But it more of watching when trend lines or fibs are near, what is order flow doing then, more or less volume coming on, is bigger volume coming in to trip the stops or is it a justified move to break through an area. You develop as you go to find answers to your questions as you go. Much harder in futures as you don't know if 10 traders buying 10 lots each or one trader doing 100 lots cause of offsetting in Globex. I prefer watching the Dome more around those areas and watching either more volume coming in or out and especially on "traps" of retail, traps often occur near end of a trend, retail might be trying to get into last wave of one direction(cause they couldn't pull the trigger to enter early so they prefer to get in late) and larger traders kept market from going retail direction. You need to watch long hours and keep good private journal.
Very tough to learn, happens in seconds and gone, matter of watching and not reading material. Years of watching you might come up with a few maybe repeatable patterns. But it more of watching when trend lines or fibs are near, what is order flow doing then, more or less volume coming on, is bigger volume coming in to trip the stops or is it a justified move to break through an area. You develop as you go to find answers to your questions as you go. Much harder in futures as you don't know if 10 traders buying 10 lots each or one trader doing 100 lots cause of offsetting in Globex. I prefer watching the Dome more around those areas and watching either more volume coming in or out and especially on "traps" of retail, traps often occur near end of a trend, retail might be trying to get into last wave of one direction(cause they couldn't pull the trigger to enter early so they prefer to get in late) and larger traders kept market from going retail direction. You need to watch long hours and keep good private journal.
Thanks for sharing. Yes I agree this would be the hardest "skill" to master if the skill actually even exists.
Look like few Japanese can master the skill and make big money out of Japanese market:
https://www.elitetrader.com/et/thre...ho-speaks-japanese-which-book-is-this.298683/
I've never found one. There are many that mention it but don't go into detail. Handle123 is correct; you just have to sit down and observe.
My observations trading the 6E using Jigsaw tools DOM and reconstructed tape are as follows.
(The following methods work well for short term trading and may not be suitable for other trading time frames)
I look for pulling and stacking of orders on the DOM but only the two or three levels closest to price. You want to see limit orders being pulled on the offer if you are long. If you start seeing sellers adding to the offers you know it might be the end of the trade.
You can easily spot absorption on the DOM which is very helpful in avoiding bad trades. The absorption doesn't always hold but the probability is it will. Often you can enter and take advantage of the stop run that usually follows.
The reconstructed Jigsaw tape allows you to filter for larger market trades. You want to see the larger traders entering in your direction. Is the reconstructed tape 100% accurate? Probably not however it seems to be reliable enough.
It takes a lot of time watching the behavior of your instrument. I suggest just focusing on one market while you learn. Also using a footprint chart that is showing Imbalance is very helpful unless you have an incredible memory. I have my imbalance set at 800% which allows me to judge when the trade may be ending. You want to see imbalance in your direction while in a trade. When you start seeing stacked imbalances going against your trade it might be time to get out.
My observations trading the 6E using Jigsaw tools DOM and reconstructed tape are as follows.
(The following methods work well for short term trading and may not be suitable for other trading time frames)
I look for pulling and stacking of orders on the DOM but only the two or three levels closest to price. You want to see limit orders being pulled on the offer if you are long. If you start seeing sellers adding to the offers you know it might be the end of the trade.
You can easily spot absorption on the DOM which is very helpful in avoiding bad trades. The absorption doesn't always hold but the probability is it will. Often you can enter and take advantage of the stop run that usually follows.
The reconstructed Jigsaw tape allows you to filter for larger market trades. You want to see the larger traders entering in your direction. Is the reconstructed tape 100% accurate? Probably not however it seems to be reliable enough.
It takes a lot of time watching the behavior of your instrument. I suggest just focusing on one market while you learn. Also using a footprint chart that is showing Imbalance is very helpful unless you have an incredible memory. I have my imbalance set at 800% which allows me to judge when the trade may be ending. You want to see imbalance in your direction while in a trade. When you start seeing stacked imbalances going against your trade it might be time to get out.

those books on market microstructure should help
This book doesnt talk about how to trade to win money

I think the main concept is that with order flow you can 'see' four different scenario's
More buyers then sellers --> obvious and price goes up
More sellers then buyers --> obvious and price goes down
Lack of buyers --> looks like there are buyers in charges but price is not really moving according to the buying, so in fact sellers are just hitting the bid with their inventory. You start see a divergency between price and delta.
Lack of sellers --> same thing like above, only buyers are in charge and price is not really moving down, buyers are in control but hitting the ask to accumalate inventory.
You see this action a lot at support and resistance. You can 'feel' after a while if support or resistance will hold or not just by looking at the action between price and orders. I do not think there is more to it.
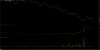
Example of divergency in chart
More buyers then sellers --> obvious and price goes up
More sellers then buyers --> obvious and price goes down
Lack of buyers --> looks like there are buyers in charges but price is not really moving according to the buying, so in fact sellers are just hitting the bid with their inventory. You start see a divergency between price and delta.
Lack of sellers --> same thing like above, only buyers are in charge and price is not really moving down, buyers are in control but hitting the ask to accumalate inventory.
You see this action a lot at support and resistance. You can 'feel' after a while if support or resistance will hold or not just by looking at the action between price and orders. I do not think there is more to it.
Example of divergency in chart
Attachments
Last edited:
I think the main concept is that with order flow you can 'see' four different scenario's
More buyers then sellers --> obvious and price goes up
More sellers then buyers --> obvious and price goes down
Lack of buyers --> looks like there are buyers in charges but price is not really moving according to the buying, so in fact sellers are just hitting the bid with their inventory. You start see a divergency between price and delta.
Lack of sellers --> same thing like above, only buyers are in charge and price is not really moving down, buyers are in control but hitting the ask to accumalate inventory.
You see this action a lot at support and resistance. You can 'feel' after a while if support or resistance will hold or not just by looking at the action between price and orders. I do not think there is more to it.
Example of divergency in chart
Can I see your second and third chart in IB?