You are using an out of date browser. It may not display this or other websites correctly.
You should upgrade or use an alternative browser.
You should upgrade or use an alternative browser.
Another Straight Line Analysis Journal
- Thread starter BonScott
- Start date
What are you talking about?
File didn't attach first time
Review of NQ 19th Feb 2014, 1 min chart attached.
Pre-market.
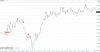
The weekly long term chart showed we were at the top of the channel with the most likely direction being a run down towards the mean of the channel.
Previous hourly swing high of 79
Previous hourly swing low at 54
1. On the open buyers tried to move the price quickly upwards. It failed at 74 which was 50% of the overnight down move. This rise was countered by sellers who brought it back to the opening low, but only held it for a few moments.
2. The buying quickly returned at the failure to break the low and the price shot up quickly. It had a few minutes pause around the opening high as sellers tried to halt the rise. It then rose again as buyers came in (possibly the people who like to trade opening range breakouts).
3. Buying stalled below the previous hourly swing high of 79.
With this failure the sellers then took over and pushed the price back down to the opening low.
4. The opening low was broken and price continued down to 65 where the selling ran out of steam, (possible profit taking).
5. Buyers briefly took over and move the price back up to 50% of the previous down move. This was rejected quickly.
6. The sellers then failed to break through the overnight 5 min swing low of 64. (The sellers failure at 64 and the buyers at 79 possibly sets the limits people are willing to trade at for the morning session).
7. Buyers now came in and moved the price slowly up to the 50% level and a few points beyond. The price went moved sideways as buyers afraid of another failure at 50% took their profits and sellers saw another chance to short down to 63 or 64.
8. The selling briefly took over as the demand line was broken slightly. This was a false dawn for the sellers, and the price started moing up again towards the swing high of 79.
9. The rise halted at 79, obviously the max price that anyone thought this was worth today, and after some profit taking the price sold of to 72, and then moved into a range roughly between 73 and 76 (the last bit isn't on my graph, Doh!)
Pre-market.
The weekly long term chart showed we were at the top of the channel with the most likely direction being a run down towards the mean of the channel.
Previous hourly swing high of 79
Previous hourly swing low at 54
1. On the open buyers tried to move the price quickly upwards. It failed at 74 which was 50% of the overnight down move. This rise was countered by sellers who brought it back to the opening low, but only held it for a few moments.
2. The buying quickly returned at the failure to break the low and the price shot up quickly. It had a few minutes pause around the opening high as sellers tried to halt the rise. It then rose again as buyers came in (possibly the people who like to trade opening range breakouts).
3. Buying stalled below the previous hourly swing high of 79.
With this failure the sellers then took over and pushed the price back down to the opening low.
4. The opening low was broken and price continued down to 65 where the selling ran out of steam, (possible profit taking).
5. Buyers briefly took over and move the price back up to 50% of the previous down move. This was rejected quickly.
6. The sellers then failed to break through the overnight 5 min swing low of 64. (The sellers failure at 64 and the buyers at 79 possibly sets the limits people are willing to trade at for the morning session).
7. Buyers now came in and moved the price slowly up to the 50% level and a few points beyond. The price went moved sideways as buyers afraid of another failure at 50% took their profits and sellers saw another chance to short down to 63 or 64.
8. The selling briefly took over as the demand line was broken slightly. This was a false dawn for the sellers, and the price started moing up again towards the swing high of 79.
9. The rise halted at 79, obviously the max price that anyone thought this was worth today, and after some profit taking the price sold of to 72, and then moved into a range roughly between 73 and 76 (the last bit isn't on my graph, Doh!)
Attachments
Review of NQ 20th Feb 2014, 1 min chart attached.
Premarket review
Previous daily high of 84.
Hourly high swing high of 60
Morning low of 38 with next If the price breaks below this, then the next big low is at 3600.
1. On the open buyers brought the price up to the 50% level of the previous 84 to 39 down move.
2. This was instantly rejected by and the demand line was broken at the same time.
There was a retracement and a price then fell.
According to my understanding of the straight line analysis method, this should have been a short entry at 60.
But I would have been too slow thinking to take it.
3. The price paused and retraced below the opening low, and at 50% of the previous up move from 39 to 64. There was an opportunity to enter a short here at around 50.
4. Sellers were in control at this point and could not be stopped until the price reached 40, where is was quickly rejected, and the support line was broken.
5. Price stayed around a mean of 48 as sellers seeing the support at the low possibly covered earlier shorts. Once this was complete the price continued upwards.
There was an opportunity to go long on the retracement.
6. Price halted at 58 and then hinged around a mean of 55. No descisive move from either buyers of sellers.
7. Eventually price broke out to just above 62. Buyers who saw the fast rejection at the open of 64 possibly decided to take their profits and the price fell slowly back to wander around a mean of 59.
8. The demand line was broken, but this near 11am, no one wanted to make any big plays.
It is clear to me that the pre-market overview of previous highs, lows, potential support or resistance levels, trends etc is vital to have a chance to react to price behaviour at those levels.
I had all the relevant levels, including 50% points written on paper to reference, but I feel that these should be written inside my head if I am going to react at the required speed when trading the 1 min charts.
Attachments
This post was delayed because my access to ET was faulty today.
Friday 21st Feb 2014, NQ100 1 min chart review
Pre market open
Previous daily high of 84.
Hourly high swing high of 60
Previous daily low of 38
Hourly low of 74
Price was near the previous daily high of 84 before the open.
Awaiting with interest the reaction of buyers and sellers at that point.
1. Price opened and 84 was touched and rejected.
A short may have been possible, but the price moved really quickly and was soon down at the premarket hourly low of 74.
Price jumped up and down really fast for first 15 minutes.
No chance to get a definite direction, because neither buyers or sellers appeared to be in control.
2. Eventually the price rose above 86 and was rejected.
There was a quick retracement and a demand line break, which was a chance to enter a short. Price
3. Price hit the opening lows and held. Sellers could take it no lower, and possibly covered to take their profits.
4. Price broke out quickly and crossed the support line, but the retracement was at the 50% point of the previous down move which was percieved as a more risky place to go long.
5. 85 was eventually reached and then price fell into a holding pattern around a 81 mean.
The action around the open was wild, and confusing. It was best to just sit and watch it happening and wait for it to slow down and resolve itself.
To become proficient at any skill, you need to break it into small parts and practise each part until they become second nature.
Personally I can have noticed that I can seeing some of the right things as price moves, but I am not currently able to process and react to it fast enough.
Monday 24th Feb 2014 NQ100 1 min chart review
Pre market open
Previous daily high of 86.
Hourly high swing high of 77
Previous daily low of 38
Hourly low of 55
Just before open, we were at 3670 on a downtrend at around 50% of previous up move.
1. Price shoots upon open to 80. There was a break of the steep demand line and a retracement. This indicated a short for below the retracement bar. Short triggered but stopped out when went above LSH.
2. Now we were looking at a sharp rise in price followed by a retracement, and a possible long above opening highs.
3. Price retraced at LSH of 86, but no demand line break.
4. Buyers obviously in charge as the price moved past high mark up to 92. Price settled in this area for a number of bars.
5. Break of demand line running from open, retracement and a short opportunity that quickly failed.
6. Breakout from congestion, and a retracement for a possible long. Getting close to 11am, and a possible slow down in price movement. Long if taken would have failed.
Tuesday 25th Feb 2014 NQ100 1 min
chart review
Pre market open
Long term trend is up, but we are
heading towards the bottom of the
hourly channel.
Previous daily high of 701.
Hourly high swing high of 90
Previous daily low of 64
Previous daily low of 38
Hourly low of 79
1. Price rose on open and then fell quickly past premarket levels down to 81 with no retracement for short entry.
2. It then retraced, and held for some minutes in a hinge pattern. This allowed a short entry at about 81.
3. It eventually broke down past 81 and reached the bottom of the rising hourly range at 69.
The rejection of the range bottom is an acceptable place for a long, but I would have waited until the rise to 75 with a small retracement or a few bars later when it went above 77.
Now that price has bounced off the bottom of the range, the most probable direction is upwards towards at east the mean of the range.
4. The price continued upwards until it was rejected at the previous hinge levels.
5. It then moved down and was rejected at 50% of the previous up move.
6. Again this rejection is a valid place for a long, but I would not have entered until the demand line broke with a retracement. Entry would have been at 82.
At the moment I am happy that I am aware of the price points where price may react. I have not the confidence to act quickly at those points without a further line break and retracement. But thats fine for now. I just need to keep practising on it. Everyday it gets clearer.
Bon,
Have you been able to grasp any conclusion from your screentime? Whatever it is that you think can be of use.
Have you been able to grasp any conclusion from your screentime? Whatever it is that you think can be of use.
Monday 24th Feb 2014 NQ100 1 min chart review
Pre market open
Previous daily high of 86.
Hourly high swing high of 77
Previous daily low of 38
Hourly low of 55
Just before open, we were at 3670 on a downtrend at around 50% of previous up move.
1. Price shoots upon open to 80. There was a break of the steep demand line and a retracement. This indicated a short for below the retracement bar. Short triggered but stopped out when went above LSH.
2. Now we were looking at a sharp rise in price followed by a retracement, and a possible long above opening highs.
3. Price retraced at LSH of 86, but no demand line break.
4. Buyers obviously in charge as the price moved past high mark up to 92. Price settled in this area for a number of bars.
5. Break of demand line running from open, retracement and a short opportunity that quickly failed.
6. Breakout from congestion, and a retracement for a possible long. Getting close to 11am, and a possible slow down in price movement. Long if taken would have failed.
Niko, my conclusions are
1. Preparation before the open is vital to have a chance to trade the 1 min in real time.
The potential support/resistance levels, channel highs, lows, and means, previous daily, hourly, and min swing highs and lows all have to be checked written down clearly, and idealy memorised beforehand.
They may all be bypassed by the market when it opens, but that says something as well.
2. LIke most of the others doing this I can see that the simple Straight Line Analysis on its own works very well as a guide to get us there, but I need to start to understand the times when it is better to enter quickly off rejections of price levels, and when to just rely on the line breaks.
3. Need to continue reading the material, learning and practise and discussion with the others on the SLA chat. Happy that I am improving each day, although as always its the choppy days or minutes that need to be perfected. Anyone can trade a big trend.
I may have different entry points to you or Db, but I'm fine with that, because we all have different risk tolerances and abilitys.
4. I have certain ideas for back-testing, but not 100% definite on it yet. Want to make sure that I know what I am looking at. Hopefully finish this week and prepare to do some testing next week.
Wedensday 26th Feb 2014 NQ100 1
min chart review
Pre market open
Long term trend is up, but we have bounced off the hourly channel mean, and are heading towards the bottom of the hourly channel at approx 80.
If this is broken the next low is 68, and then 55.
Previous hourly high of 701 and low of 68.
1. On open moved up to top of 5 min channel (from 03:00) and was rejected fast.
2. Didn't break through the pre-market open lows. Instead price rose again and stopped at 95 which was 50% of previous down move from 701 to 68. There was a retracement soon after and a possible short below 90
3. The next area to watch for was the hourly channel bottom at around 79.
4. The price bounced off the bottom of the channel, and provided a retracement for a potential long entry at 81
5. Price rose again until it hit the hourly mean of 92. I didn't spot the mean myself, which was an error in my preparation.
6. The mean was rejected straight away and could have shorted at 89. The move went very fast down to 84, the 50% level of the previous up move.
7. The price then made a hinge until 10:21 when it broke out of the hinge and the 5 min channel top. There was a quick retracement and the opportunity for a long from about 93.
8. The price continued up to Mondays high of about 701 and then stalled. Eventually the demand line from 9:53 was breached but we were getting close to 11am,
We had made a big rise from 79 and expected that the hourly channel high of 710 might be tested, but it didn't happen.
Today was one of those big up and down days, where I felt like I could have made the entries at good points if I had been trading. My awareness of important price levels helped, as did the discussions with others on the chat.
Tomorrow is another day and another lesson.