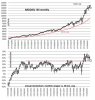
Svalbards Jul 3, 2021 #1 How do I setup TWS graphs to show annual momentum: monthly ranges vs. 36-month average? The moving avg. is supported in TWS but how about this momentum indicator? Graphs attached. Attachments annual momentum.JPG 115.8 KB · Views: 34
How do I setup TWS graphs to show annual momentum: monthly ranges vs. 36-month average? The moving avg. is supported in TWS but how about this momentum indicator? Graphs attached.
Svalbards Jul 3, 2021 #3 Thanks. I see no such real function. I guess the Bollinger band function would give me similar information as above. https://www.interactivebrokers.com/...lanalytics/apply_bollinger_band_indicator.htm
Thanks. I see no such real function. I guess the Bollinger band function would give me similar information as above. https://www.interactivebrokers.com/...lanalytics/apply_bollinger_band_indicator.htm