An Excel App to Facilitate Manual Strategy Testing on Tradingview

This is all very detailed and helpful. Thank you for taking the time to reply in such a fast manner. Would you mind providing some screenshots or even better a screen record so I can visualize everything you've done?

Also, how exactly do you copy the information from tradingview? I don't understand how is it possible to write the first two dates manually and Excel to do the rest of the work. Do you still do it manually or use some sort of magic?

Thank you!
Here is a screenshot of my basic layout for data entry into Excel.
Cell A16 tells the double-click events macros that the working column is column B.
This directs the event handler to recognize double-clicks in columns B and C, besides column A.
Cells A9 through A14 are sensitive to double-clicks, each one feeding a macro, most of which are for navigation up and down the working column (B).
Clicking on cell A9 will deposit starting and ending date-times into cells A7 and A8...and into the clipboard. I've pasted that info into each working column in rows 10 and 11 to facilitate a macro that will consolidate all this info into .csv files.
Row 15 in each working column (B15) tells the click macros how many decimals are in the price for this symbol. Entered manually.
Row 16 in each working column (B16) is used to store the last price that was manually entered via the input box macro. Stored automatically by a macro to help it's next calculation.
Next to that is a + or -, which is storage for the last position that was manually marked into the support column (C16). Stored automatically by a macro to help it's next calculation.
Column A serves all other columns. You only need to do this once. You can enter a date-time in cells A18 and A19, grab them, and pull down. Excel will see the pattern and continue. In this case the pattern is three minute increments. So it continues every three minutes, and handles the change in dates too. (You can also do this with VBA using the DateAdd() function).

I color even days green, and odd days pink.
Rows 2 through 8 in each working column give me enough info to track all this, and to go back to Tradingview and find my marks to resume work there. Otherwise, almost guaranteed they will be lost in a black hole.

Screenshot 2023-03-08 003920.png


Ok, in the left hand screenshot below, this is what it looks like after i've made my first pass at collecting data from Tradingview. I scroll down until i find the date-time of an entry or exit (or reversal) and click on column G. If the working column is F, this will trigger a macro that sets either an "+" for long position, or a "-" for a short position. You can put whatever string you like. Conditional formatting recognized my symbols and color codes green for a long position or a red-pink for a short position. Most of my positions are reversals, so i have my macro alternate the "+" and "-" symbols. But that can be reversed again by double clicking on either symbol.
While it enters a symbol in column G, it also enters an "O" (for Open) in column F.
Another macro will see the "O" and trigger some other things.
If i click on column F when there is nothing in column G, it will put a "C" which stands for Closed position (See 11/9/22 8:09 on the left below).

Now, looking at the screenshot on the right below, if i click on either and "O" or a "C", i'll get an input box asking me for the price where i'm taking this position at this time. Upon entering the price, the macro will take me down to the next "O" or the next "C" that it sees, and ask again for the price at that point. This two part process, with the assist of the macros, reduces mistakes to a very minimum. Notice the last price in the right side screenshot does not have a position, either long or short. The evaluation engine, which processes all this data, recognizes this as a closed position and handles it.

Screenshot 2023-03-08 001209.png
Screenshot 2023-03-08 001454.png


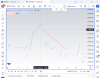
In the chart below i've marked up candlestick charts using trendlines for entry and exit.
Screenshot 2023-03-08 013704.png


But it's still cluttered. I just need a little info. So i make the bars disappear by clicking on the eyeball which you can see if you hover your mouse over the first line at the top after where it says BITTREX.
Screenshot 2023-03-08 013744.png

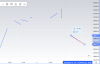
Now the screen is uncluttered and i can zero in on my entries and exits. In this particular window, i've used the same window to mark up both daily, as well as 4 hour time frames with the same algo/method. I've used red lines to mark the daily frames, and blue lines to mark the 4 hour frames. As mentioned, i use red to mark short trades, and blue to mark long trades. So a red mark slanted downward is going to be a winner. A blue mark slanted upward will also be a winner. And visa versa. It looks like i'm only taking long trades in the 4 hour time frame, and short trades on the daily. No. I'm marking longs and shorts on both. Mine is an always in method. The blank space between the red marks will be recognized, by the evaluation engine, as a long trade. The blank space between the blue marks will be recognized as short trades.
 
Last edited:
For those who are interested in using Microsoft Excel for stock charting, Stocks & Commodities magazine has Excel tips. If you need to go to 2011 Feb, change 01 to 02. The same goes for year. There are scripts for various charting software. Just a note of caution, Excel cannot do heavy lifting for stock screening and back testing. It will crawl when screening for more 1000 stocks.
TRADERS’ TIPS - January 2011
 
Here is a full screen screenshot with Excel docked on the left and Tradingview snapped to the right. In this example i am going to get the information for the short trade on September 13, 2022 at 13 hundred hours (1 PM).


Screenshot 2023-03-08 020140.png


In the screenshot below, you can see my vertical crosshairs lined up at the start of a red trend line. Down below that, at the bottom of the chart, you can read Tue 13 Sept 22 13:00. You can see that i've entered that in Excel, looking at the screenshot above. I've marked a short position for that date-time.

Screenshot 2023-03-08 020416.png


Now that i've marked the position at that date-time, you can see below how i have lined my horizontal crosshair on the price, at the start of that same red trend line. On the right side of the chart you can see the price as 21608.875. I'm going to be dropping the digits to the right side of the decimal since they are too insignificant at this price level. In this process, i'm just hovering my mouse over Tradingview. This keeps Excel still in focus. Thus, my next keystroke will start entering a price into an input box.
Screenshot 2023-03-08 020516.png

In the screenshot below, i've clicked on the "O" and up popped an input box in the upper right. It tells my what was the last price i entered which was 17122. Because the price is now 21608, i need to replace all the digits. But if the price was now 17123, i would only need to replace the last digit, 3, and the macro will take care of the rest. Upon entry, the macro will skip down to the next "O" that it sees, and offer another input box, telling me what it put for the last price. If all looks good, i will continue. If not, abort.


Screenshot 2023-03-08 022016.png


The input box says "speak or type"... because the macro will also accept speech. But i don't have a good microphone so there are too many errors there. The most common errors can be rectified automatically within the macro though.

Anyway, to repeat myself, i would go through all my marks on the charts and gather together all the positions, (long or short or close) at the right date-time coordinates. Then, i'll start from the top and enter all the prices with the assistance of a macro that will walk me through all the "O" or "C" marks that it sees.
 

Attachments

  • Screenshot 2023-03-08 020516.png
    Screenshot 2023-03-08 020516.png
    109.2 KB · Views: 8
  • Screenshot 2023-03-08 020516.png
    Screenshot 2023-03-08 020516.png
    109.2 KB · Views: 7
Last edited:
It's much more clear how you do this now. It's a very complex system to develop, I admire your effort.

What you did with the lines is very cool, but won't work for me.

Sadly - just like me, you also write down the numbers by hand, which inevitably is prone to mistakes, no matter how easy you've made the process.

I'm looking for complete automation - a process that will autonomously scrape the data upon entering the trades. Sadly tradingview does not offer that, nor you can manually enter trades in the "Strategies" section which allows direct export of data.

A stumbled upon an app called Replay FX which can be a part-time solution but does not satisfy my needs.

Cheers!

For a manual collection system, i don't know how it would be possible to reduce the number of mistakes more than this system does. Perhaps the voice input could be improved. It would be nice if Pinescript recognized these marks but it doesn't. The most robust version of VB (VB.NET) probably could capture any mark that you clicked on with a mouse. But i'm not confident that the endpoint coordinates collected could be coordinated with Price and Time.

What makes me say that is i have seen the development of a robot that would capture casino applications on the desktop, take over, and actually make bets (for roulette). The problem, as i recall, is that the casinos did not like robots, as if they were not sure whether they really had a house edge or not. Casinos could tell the robots because of the speed which they can bet, without taking any breaks. So the robot, written in VB.NET (heavily dependent on Windows DLLs), had to slow itself down to imitate a human.

So, you could probably scrape Tradingview graphics but only if the bot had a way to coordinate the endpoints of a line to Time and Price. I doubt it could be done with the Tradingview TrendLine, but might be done with the Tradingview InfoLine. The amount of programming effort to do that might be better invested in mastering PineScript, or a VBA trading script which accurately reflects your intentions when fed raw historical data.

I was able to articulate my own trading intentions to VBA, and found that the effort to handle these manual methods, and the efforts to process/calculate and present (in charts) was a lot more work than the actual algorithm i intended to test. Probably all the manual work done helped to articulate the algorithm, but more importantly, helped motivate the work needed to prove my theory through code.

Screenshot 2023-02-26 154145.png


The blue line above is all of my manually collected BTC trades sourced from Bittrex historical data charted on Tradingview. The brown line, underneath the blue, is my intended algorithm against Bittrex historical data from a third party. Shows underperformance which could be due to discrepancies in data. But it tracks close enough to indicate that the algorithm, as expressed in code, is close, if not close enough to my intentions. The gold line above the manual line is the algo applied to BTC data sourced from Binance, also from a non-Tradingview third party (CoinGekko/Cryptosheets). For some reason, it outperforms at a different exchange. The silver line above is the algo applied to ETHEREUM sourced history from Bittrex. I'm assuming ETH is more volatile, and the algo does a little better with more volatility.

Stats:
Screenshot 2023-03-21 183548.png

View attachment 309690
 
Last edited:
For those who are interested in using Microsoft Excel for stock charting, Stocks & Commodities magazine has Excel tips. If you need to go to 2011 Feb, change 01 to 02. The same goes for year. There are scripts for various charting software. Just a note of caution, Excel cannot do heavy lifting for stock screening and back testing. It will crawl when screening for more 1000 stocks.
TRADERS’ TIPS - January 2011

I'm a believer in VB (Either VBA or VB.NET) when combined with computing power which is increasing is speed faster than languages are getting faster. Computing power has come a long way, and has been made more affordable since 2011. The most recent iteration of Python is supposed to be significantly faster, but actually, all anyone needs to do is upgrade to a faster CPU, more RAM, and the latest data storage tech. Presumably, a good trader, with a good method, could afford it.

Here is a guy (I'm not affiliated) who uses Excel for all his back-testing, and recently, is collaborating with someone who has turned his Excel sheets into a fairly quick robot for live trading. He is expert at using Excel formulas in ranges. Anymore, i avoid Excel formulas and ranges, and just stick to VBA, arrays, and flat files as much as possible, mainly using chart functions to express results.


I mention this because i feel i've wasted time being tempted to learn other, supposedly more powerful, or more dedicated languages, Python, EasyLanguage, MetaTrader (MQL), Pinescript. There is a lot of power in VB and even VBA with its ability to connect with any API your broker/exchange might offer. Given the data, VBA can really handle any kind of algorithm you can imagine. It's really up to your hardware to make sure it handles it fast enough. There was this one guy who did really extensive computations on the entire forex market. He got data through MT4, and placed trades through MT4, but he sent all his heavy computations out to Excel and traded whatever Excel said to trade after making a round trip.
 
Last edited:
Ok, here is a brand new way to log from Tradingview to Excel. I've included an example sheet to show how data can be logged into the sheets and charted with the help of VBA. There is no VBA in the included Excel example.

Seen below in the screenshots is shown my usual trendlines delineating various trades, and as usual, i have the bars disappeared so i can unclutter the screen. What's different this time is instead of gathering four data points per trade (price in, bias in, time in, time out), it's just one data point. The redline shown is an InfoLine with two bits of information: % gain/loss, and time-in-trade. You can use both, or, just use the %gain/loss, and keep it really simple. Just overlay each Trendline with an Infoline and log the information given and just keep the Infoline moving along, from trade to trade. In this example, we see -.67% for a trade that lasted 2 hours.


Screenshot 2023-05-06 193541.png
Screenshot 2023-05-06 193737.png


Screenshot 2023-05-06 195603.png


In the sheet above, i show how you can track both %Change, and Time. For February 13th i start out with a Time for the series, an opening price for the series, and an orientation for the first trade in the series. My trades are continuous, either long or short so i can get away with this. If not, then if you want more than just %Change information, you have to mark each trade. In this example, i've marked %Change and Time as a string separated by an asterisk*. The first trade is a %Change of positive .73%, with a duration of 240 minutes. It was short. The next trade is negative -.17% with a duration of 90 minutes. The first trade was short so this one was long. With this much information you can build any kind of chart or any number of statistics you might want.

Screenshot 2023-05-06 201143.png


Above is shown a very simple method of logging. I'm just tracking the %Change for each trade on each day/date. The header information is really extra, for statistical extras. Each symbol and timeframe combination has it's own sheet. The sheets are named in a special way to group them together for charting purposes. VBA will cycle through the sheets, pick up what info is available, and deposit into chart groups.
 

Attachments

  • Example.xlsx
    Example.xlsx
    199.1 KB · Views: 6
  • Screenshot 2023-05-06 193813.png
    Screenshot 2023-05-06 193813.png
    61.3 KB · Views: 4
Last edited:
Back
Top