He's absolutely right, and you can easily enough STFW for examples of Jupyter notebooks.
You are using an out of date browser. It may not display this or other websites correctly.
You should upgrade or use an alternative browser.
You should upgrade or use an alternative browser.
AmiBroker or R or Python?
- Thread starter ngterry
- Start date
@M.ST.
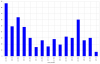
Lastly I wanted to tested an Open Range Breakout system for SPY, therefore I would like to check, when a high or low of the day occured for every 30 minutes. Analyzing this in Jupyter took me about 10 lines of code, the result is a graph, check the attachment.
This is the Python / Jupyter code:
Lastly I wanted to tested an Open Range Breakout system for SPY, therefore I would like to check, when a high or low of the day occured for every 30 minutes. Analyzing this in Jupyter took me about 10 lines of code, the result is a graph, check the attachment.
This is the Python / Jupyter code:
Code:
import pytz
 import matplotlib.pyplot as pyplot
import numpy as np
import pandas as pd

# code below
data = get_pricing(
     'SPY' ,
    start_date='2015-1-1',
    end_date = '2016-9-1',
    frequency='minute'
)
df = data.resample('30min',"ohlc")["open_price"]
df = df.dropna()

df["high_rank"]=df.groupby([ df.index.dayofyear])[["high"]].rank(method="max",ascending=False )
df["low_rank"]=df.groupby([df.index.dayofyear])[["low"]].rank(method="min",ascending=True)
l_or_h=df[((df.high_rank==1) |(df.low_rank==1) )].groupby( ["hour","minute"] ).agg("count")["high_rank"]
l_or_h.plot(kind='bar')
Attachments
If you are a seasoned programmer you can do everything in your language, this type of guys are seldom changing to other system, I hear people talking all the time of the benefits of vi and emacs as an IDE ") ))
))
But for the rest of us, the not professional programmers, not even nerds, Python is a mean to achieve many things, just seasoned programmers could do otherwise. And the benefits of Python over R oder Amitrader is, from my point of view the possibilities to glue so many different libraries together.
))But for the rest of us, the not professional programmers, not even nerds, Python is a mean to achieve many things, just seasoned programmers could do otherwise. And the benefits of Python over R oder Amitrader is, from my point of view the possibilities to glue so many different libraries together.
And the benefits of Python over R oder Amitrader is, from my point of view the possibilities to glue so many different libraries together.
Nonsense, you have access to libraries in R and AmiBroker also. You don't know anything about those as you clearly prove by your absolute beginners talk.