Hi all,
It's often been said here and elsewhere that charts don't contain all relevant information and that there are other ways to perceive historical data.
I have some ideas about what this means, but I'm curious what else I might be missing.
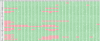
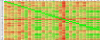
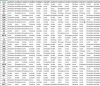
For instance, data can be put in tables. One could calculate statistics. Rule based strategies might be utilized, i.e., opening range breakouts as an example. Might tick data be better to analyze than say 30-second or 1-minute OHLC data?
Could Excel or other spreadsheets possibly be used to create custom charts or displays of data?
What are quants looking at in their models?
Any thoughts on this?
It's often been said here and elsewhere that charts don't contain all relevant information and that there are other ways to perceive historical data.
I have some ideas about what this means, but I'm curious what else I might be missing.
For instance, data can be put in tables. One could calculate statistics. Rule based strategies might be utilized, i.e., opening range breakouts as an example. Might tick data be better to analyze than say 30-second or 1-minute OHLC data?
Could Excel or other spreadsheets possibly be used to create custom charts or displays of data?
What are quants looking at in their models?
Any thoughts on this?