
So people are saying that volume can lend some clues to what price is going to do next. They say you should watch the Time and Sales to see where the big orders are coming in.
Since it's hard to post about Time and Sales in real time, and you can't really view it after the fact, I've tried to come up with a way to show big orders on a chart so we can look back and see where they came in.
Because of the limitations both in my charting program as well as in my programming ability, the best I could come up with was to monitor bid and ask volume of a one second chart and then overlay that data on a slower chart (in this case, 5000 volume ES).
I divided it up into 6 possibilities:
Small light yellow dot = 300-599 contracts traded at the ask in one second
Small dark yellow dot = 600-1199 contracts traded at the ask in one second
Big orange dot = 1200 or more contracts traded at the ask in one second
Small light blue dot = 300-599 contracts traded at the bid in one second
Small blue dot = 600-1199 contracts traded at the bid in one second
Big dark blue dot = 1200 or more contracts traded at the bid in one second
I kind of arbitrarily picked those values.
My goal was to see if at S/R points there were any particular volume trends, such as huge volume coming in either at the bid or ask before a reversal.
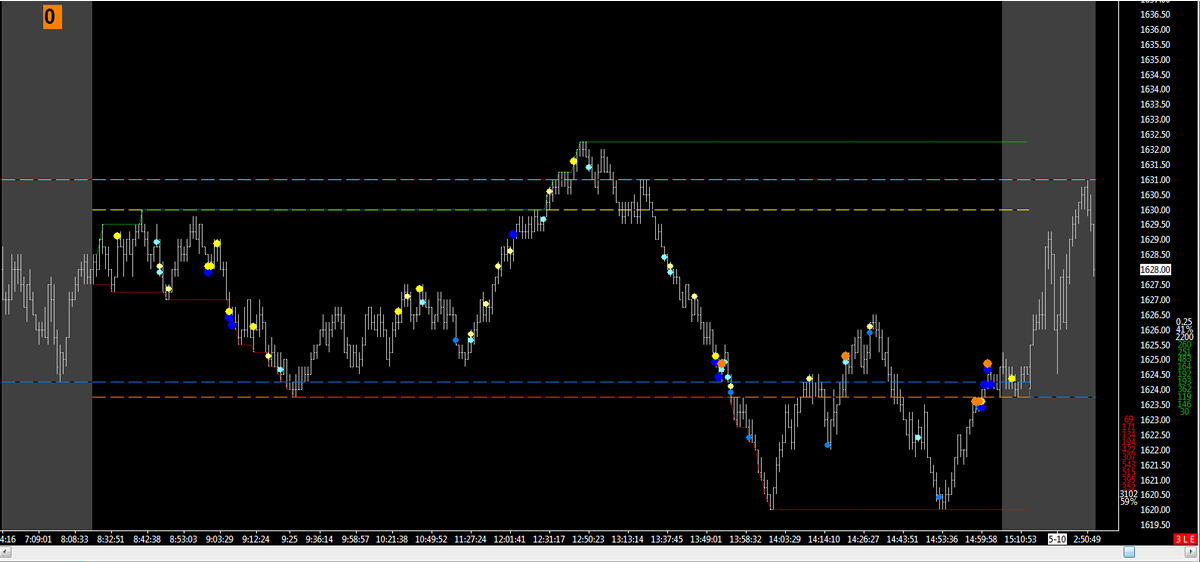
The only thing that seems kind of significant was the large number of big trades around 13:52-13:54 as price approached the dark blue line (overnight low). Price then broke through that price and went down another 4 points.
As you may expect, sometimes there are big orders near S/R points. Sometimes there are big orders in the middle of trends. Sometimes there are no big orders near S/R points.
In other words, there seems to be no predictive nor confirmation value.
If anyone would like to see the chart using different volume numbers at the bid or ask let me know and I can change them and post the new chart.
Question: if volume is significant at certain levels, what are you looking for? Because these might as well be random dots.
The only thing that isn't random is the number of large dots near the end of the day, but that makes sense because there's always a lot of volume then as people close out their positions.
Since it's hard to post about Time and Sales in real time, and you can't really view it after the fact, I've tried to come up with a way to show big orders on a chart so we can look back and see where they came in.
Because of the limitations both in my charting program as well as in my programming ability, the best I could come up with was to monitor bid and ask volume of a one second chart and then overlay that data on a slower chart (in this case, 5000 volume ES).
I divided it up into 6 possibilities:
Small light yellow dot = 300-599 contracts traded at the ask in one second
Small dark yellow dot = 600-1199 contracts traded at the ask in one second
Big orange dot = 1200 or more contracts traded at the ask in one second
Small light blue dot = 300-599 contracts traded at the bid in one second
Small blue dot = 600-1199 contracts traded at the bid in one second
Big dark blue dot = 1200 or more contracts traded at the bid in one second
I kind of arbitrarily picked those values.
My goal was to see if at S/R points there were any particular volume trends, such as huge volume coming in either at the bid or ask before a reversal.
The only thing that seems kind of significant was the large number of big trades around 13:52-13:54 as price approached the dark blue line (overnight low). Price then broke through that price and went down another 4 points.
As you may expect, sometimes there are big orders near S/R points. Sometimes there are big orders in the middle of trends. Sometimes there are no big orders near S/R points.
In other words, there seems to be no predictive nor confirmation value.
If anyone would like to see the chart using different volume numbers at the bid or ask let me know and I can change them and post the new chart.
Question: if volume is significant at certain levels, what are you looking for? Because these might as well be random dots.
The only thing that isn't random is the number of large dots near the end of the day, but that makes sense because there's always a lot of volume then as people close out their positions.


