There is a good academic explanation for it, too. Most of the news and economic releases occur before the equity open, so predictably most equity risk premium accrues overnight.Fair enough, it did look like the results were similar but not as strong. I would like to run more tests on this. Looks like I will be doing some NT scripting in my near future.

You are using an out of date browser. It may not display this or other websites correctly.
You should upgrade or use an alternative browser.
You should upgrade or use an alternative browser.
Wow, this I wasn't aware of. Thanks! I don't know if you have any other info for past quarters, but if so please post it here.
That is basically what the entire data set looks like. The hot and heavy selling happens during hours, less of it after hours.
Here you go:
This is for Q42018 specifically
Actually I found out about this years ago during research. Just download yahoo finance ohlc data on a spreadsheet you can calculate easily
Shows you day session is a waste of time. Just a bunch of people trying to screw each other.
The market is NOT fractal. There is an optimal time frame to trade. And that is not intraday.
Shows you day session is a waste of time. Just a bunch of people trying to screw each other.
The market is NOT fractal. There is an optimal time frame to trade. And that is not intraday.
You probably would get even more "pickup" if you are only holding it over the weekend (Friday close to Monday open). This said, we are probably talking about Sharpe ratios of 0.9 or something like that. Also, since it's a risk premium effect you get better pnl/tradeval if you use more volatile stocks or ETFs.
I posted this earlier in another thread in response to a member here, Rickshaw Man, who goes on and on about how its free money. (he doesn't seem to post on days it doesn't work)
This chart covers the overnight period per one bar for the ES. The open of the bar happens at 16:14:59 pm, and the close is at 09:29:59, just before the market open. I went back far enough to cover the huge drop we had at the end of last year. This is clearly not a quantitative analysis, but you can easily see how many red vs. green bars there are. Obviously, if you bought the close and the bar is red, then the market opened even lower, and hence you would have lost money. Even during the recovery since Xmas day, there are still many overnight sessions which would have lost you money.
This chart covers the overnight period per one bar for the ES. The open of the bar happens at 16:14:59 pm, and the close is at 09:29:59, just before the market open. I went back far enough to cover the huge drop we had at the end of last year. This is clearly not a quantitative analysis, but you can easily see how many red vs. green bars there are. Obviously, if you bought the close and the bar is red, then the market opened even lower, and hence you would have lost money. Even during the recovery since Xmas day, there are still many overnight sessions which would have lost you money.
Attachments
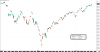
Could you go back 10 years?This chart covers the overnight period per one bar for the ES. The open of the bar happens at 16:14:59 pm, and the close is at 09:29:59, just before the market open. I went back far enough to cover the huge drop we had at the end of last year. This is clearly not a quantitative analysis, but you can easily see how many red vs. green bars there are. Obviously, if you bought the close and the bar is red, then the market opened even lower, and hence you would have lost money. Even during the recovery since Xmas day, there are still many overnight sessions which would have lost you money.
 in fairness, all of these studies assume a perfect MOO and MOC fill and, as I said before, once you start looking at anything tradeable the effect is really thin.
Sadly no. I only have data since 2013. (Sierra Charts might have 1 minute data for 10 years though on their servers and that is good enough to build these charts)Could you go back 10 years?
I did just now load up 2000 days, and I get this chart that does go back to 2013. I squeezed the chart to fit in more bars, and it spans 6 files, but I can upload them all here for at least a visual look.
Attachments
-
![ES-201906-GLOBEX [CV] 1 Day #11 2019-04-13 21_03_01.245.png](/et/data/attachments/182/182811-8a0b4db5c58e0714a041038e7ec4dcb1.jpg?hash=igtNtcWOBx) ES-201906-GLOBEX [CV] 1 Day #11 2019-04-13 21_03_01.245.png35.2 KB · Views: 44
ES-201906-GLOBEX [CV] 1 Day #11 2019-04-13 21_03_01.245.png35.2 KB · Views: 44 -
![ES-201906-GLOBEX [CV] 1 Day #11 2019-04-13 21_03_15.334.png](/et/data/attachments/182/182812-e5e94422528337be2e6d9a4d24112e9d.jpg?hash=5elEIlKDN7) ES-201906-GLOBEX [CV] 1 Day #11 2019-04-13 21_03_15.334.png29.6 KB · Views: 31
ES-201906-GLOBEX [CV] 1 Day #11 2019-04-13 21_03_15.334.png29.6 KB · Views: 31 -
![ES-201906-GLOBEX [CV] 1 Day #11 2019-04-13 21_03_23.373.png](/et/data/attachments/182/182813-75c60cb31af649ee8f3ebc21360684b2.jpg?hash=dcYMsxr2Se) ES-201906-GLOBEX [CV] 1 Day #11 2019-04-13 21_03_23.373.png30.6 KB · Views: 29
ES-201906-GLOBEX [CV] 1 Day #11 2019-04-13 21_03_23.373.png30.6 KB · Views: 29 -
![ES-201906-GLOBEX [CV] 1 Day #11 2019-04-13 21_03_35.453.png](/et/data/attachments/182/182814-3d18b9aa05b6aa6d9af3492cfb3c3bd8.jpg?hash=PRi5qgW2qm) ES-201906-GLOBEX [CV] 1 Day #11 2019-04-13 21_03_35.453.png30.1 KB · Views: 33
ES-201906-GLOBEX [CV] 1 Day #11 2019-04-13 21_03_35.453.png30.1 KB · Views: 33 -
![ES-201906-GLOBEX [CV] 1 Day #11 2019-04-13 21_04_19.734.png](/et/data/attachments/182/182815-9260619ee518ab455d9b580e809e5924.jpg?hash=kmBhnuUYq0) ES-201906-GLOBEX [CV] 1 Day #11 2019-04-13 21_04_19.734.png33.3 KB · Views: 26
ES-201906-GLOBEX [CV] 1 Day #11 2019-04-13 21_04_19.734.png33.3 KB · Views: 26 -
![ES-201906-GLOBEX [CV] 1 Day #11 2019-04-13 21_04_33.808.png](/et/data/attachments/182/182816-737977f137c8b597c9242a75b100fd63.jpg?hash=c3l38TfItZ) ES-201906-GLOBEX [CV] 1 Day #11 2019-04-13 21_04_33.808.png35.8 KB · Views: 29
ES-201906-GLOBEX [CV] 1 Day #11 2019-04-13 21_04_33.808.png35.8 KB · Views: 29
I honestly do not think this is a problem. You can easily enter a market order at 16:14:45, and you have 15 seconds to get your fill which clearly wont be a problem in the ES.in fairness, all of these studies assume a perfect MOO and MOC fill and, as I said before, once you start looking at anything tradeable the effect is really thin.
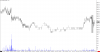
This is a 1 second chart of the ES. I outline in gray the area in the last 15 seconds before 16:15 shutdown. You see many bars have a volume of 400 contracts. Yes price does move a few ticks, but that is nothing compared to the 10 or 20 points gap up or gap down openings that happen. You can snag all the contracts you want in that time I suspect.
Attachments
K
krugman25
I'm glad there is someone here that caught this effect a long time ago. I think that gives you an interesting angle on it. It sounds like it helped influence your decision to not trade during hours.Actually I found out about this years ago during research. Just download yahoo finance ohlc data on a spreadsheet you can calculate easily
Shows you day session is a waste of time. Just a bunch of people trying to screw each other.
The market is NOT fractal. There is an optimal time frame to trade. And that is not intraday.
Right, so there is obvious positive mean. My guess is that it's going to be about 3-4 basis points on average with a significant negative skew (e.g. like 3 bps mean, 4 bps median) and a Sharpe from 0.7 to 1.1. I can run the study, but I am too lazyI did just now load up 2000 days, and I get this chart that does go back to 2013. I squeezed the chart to fit in more bars, and it spans 6 files, but I can upload them all here for at least a visual look.
That's not what I am saying, though. I don't think execution is the issue if you do it via futures, it's the study that's a problem since it makes assumptions based on nebulous nature of the open and close prints for an index. There is plenty liquidity to trade this, but you are going to pay away a lot of the "alpha" in transaction costs.I honestly do not think this is a problem. You can easily enter a market order at 16:14:45, and you have 15 seconds to get your fill which clearly wont be a problem in the ES.