Usually they are one in the sameI see the losers of E.T. went from "stealth vendor" to "poser".
")
Usually they are one in the sameI see the losers of E.T. went from "stealth vendor" to "poser".
Usually they are one in the same
A very smart computer makes the charts. I'm going to explain how the computer works.
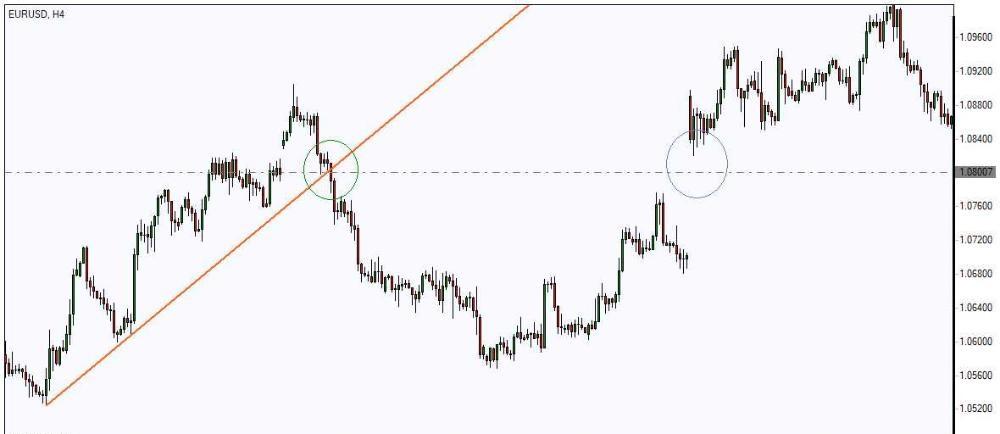
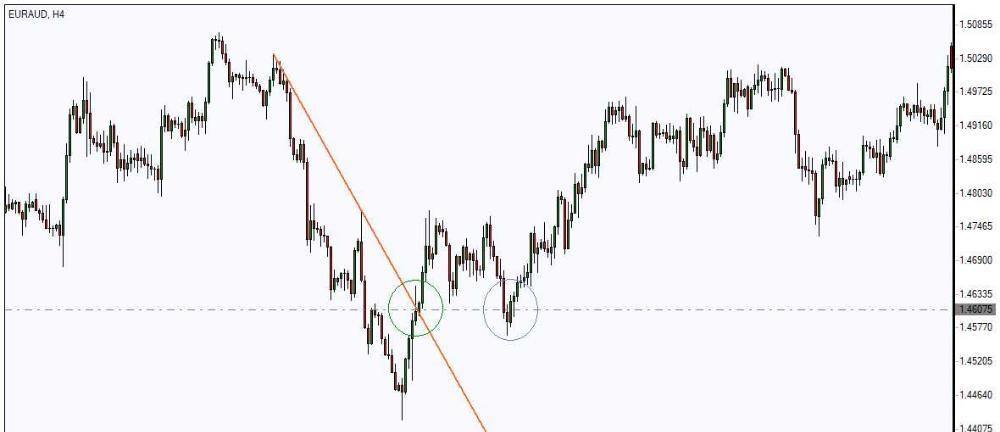
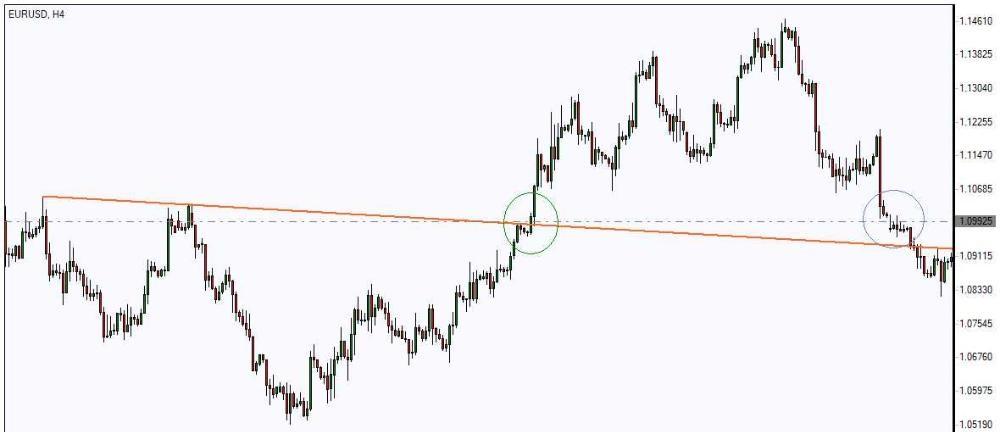
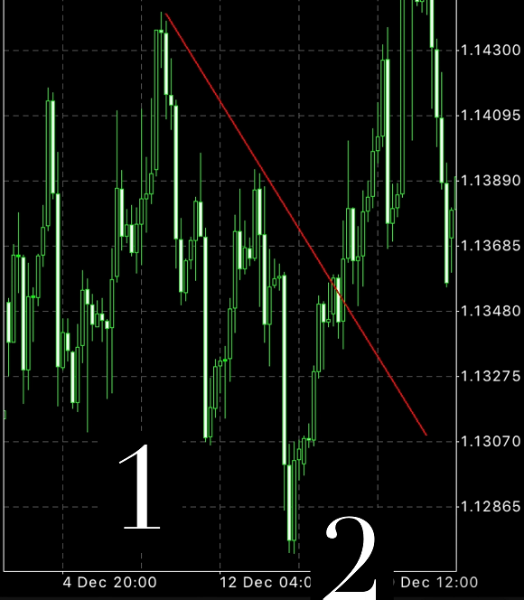
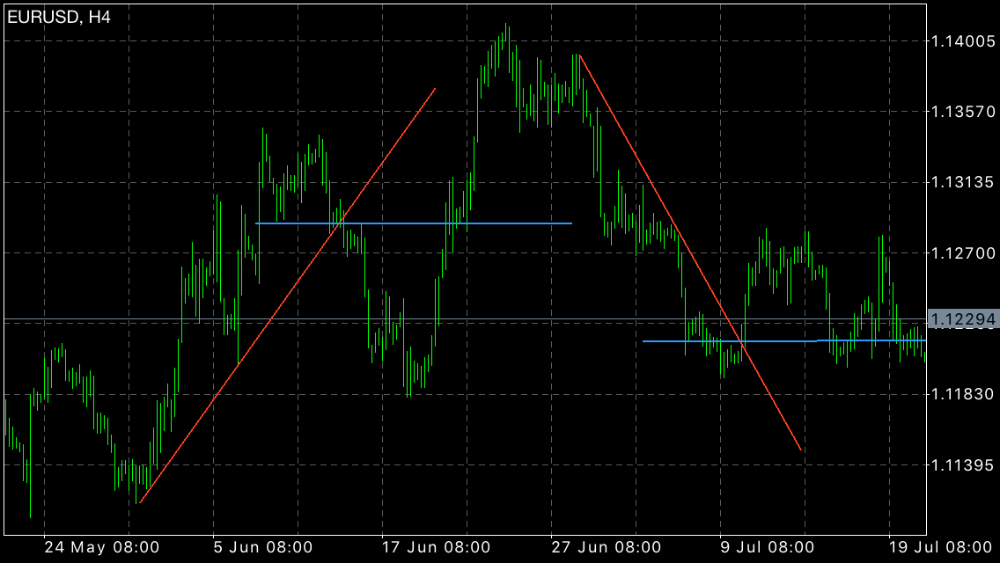
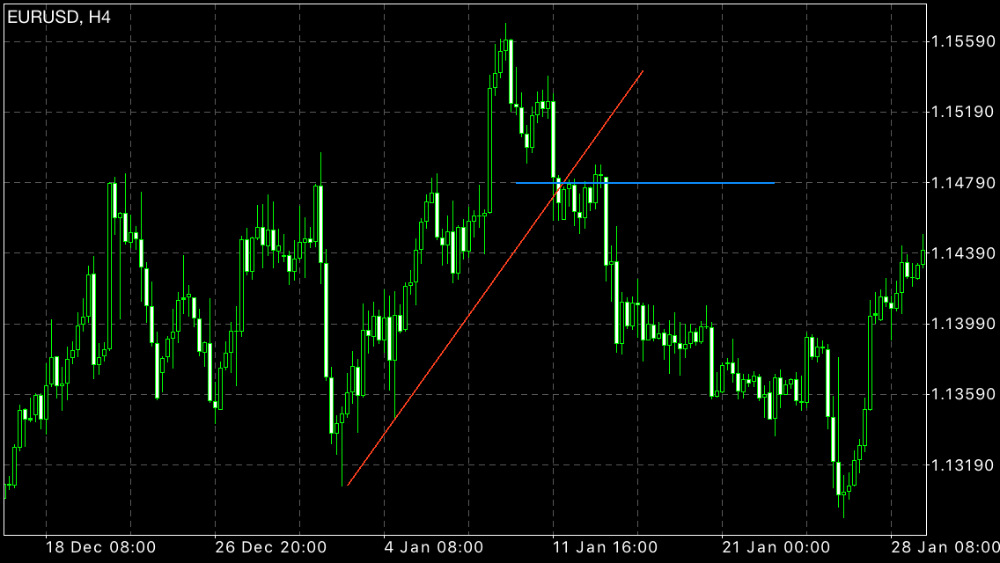
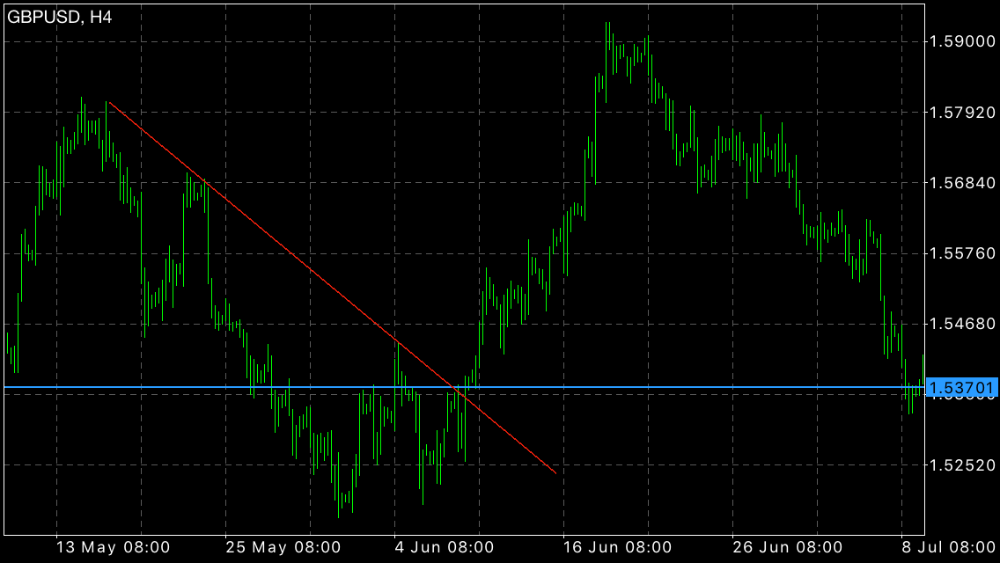
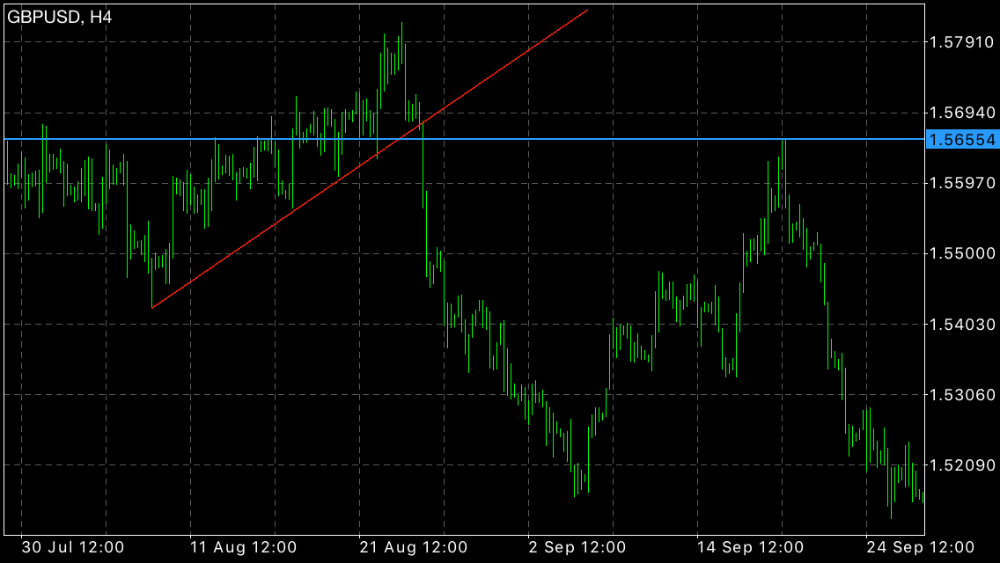
Look at the three pictures.
When the price breaks a trend line, after a time-span, the price will come back to the break point.
The time-span can be short or very long. It often happens. About 95%.
You can check the past. You will find so many samples.
It happens in every time frames. 15M , H1 , H4 , Daily , Weekly. But H4 is the best.
Draw the trend lines from the tip of the bars.
Three examples:
True Trend Line
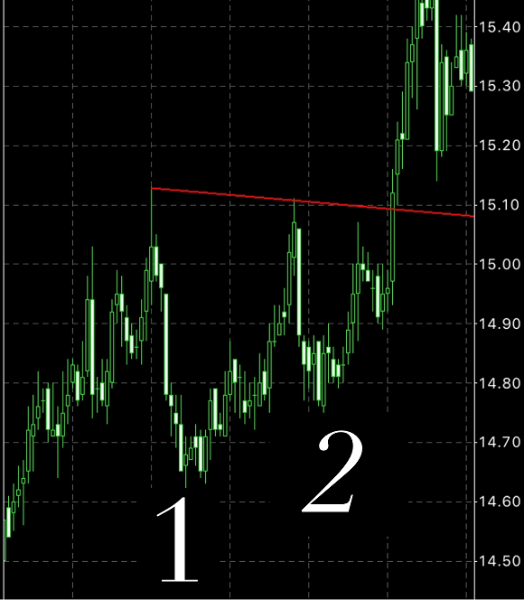
Look at the two pictures.
The first picture: False
Because the second peak is not below the first peak.
The second picture: True
The second peak is below the first peak.
Draw the trend lines from the tip of the bars.
The trend line should touch the first and second peaks. It’s so important. Some people don’t care about the second peak.
How to trade?
You should trade when the price comes back to the break point.It often happens. About 95%.
You need experience. Check the past to see more examples.
How to find the return points?
You can use Fibonacci for finding the return points.
Draw the Fibonacci from the start point of the trend line and end it at the highest or the lowest bar before the break point.
In these picture, the price has returned after touching the 161.80% or 61.80% of the Fibonacci.
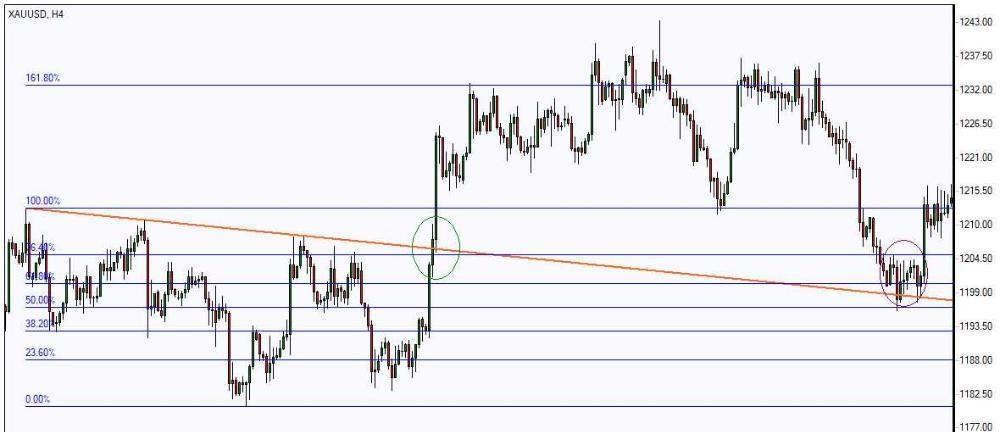
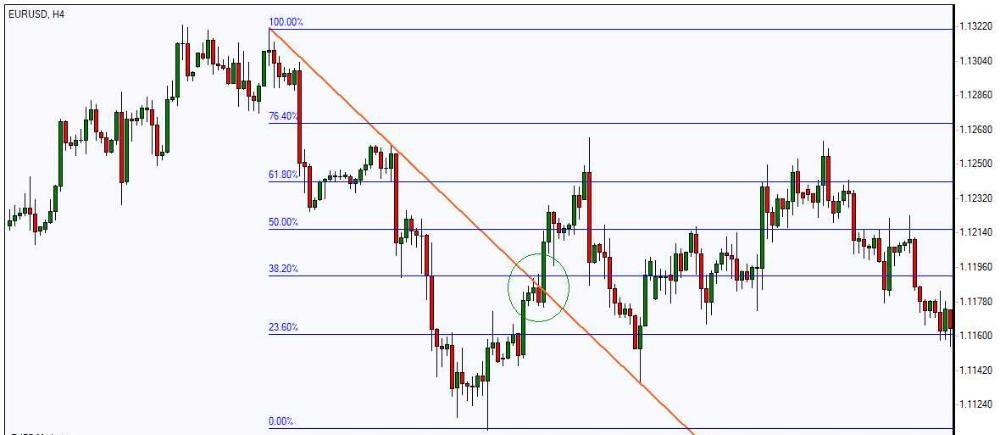
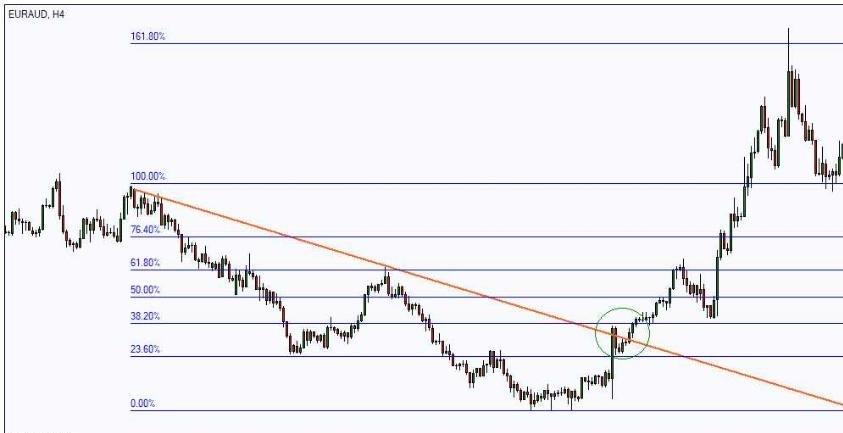
Five examples:
Man, you got that BACKWARD.A very smart computer makes the charts. I'm going to explain how the computer works.
Look at the three pictures.
When the price breaks a trend line, after a time-span, the price will come back to the break point.
The time-span can be short or very long. It often happens. About 95%.
You can check the past. You will find so many samples.
It happens in every time frames. 15M , H1 , H4 , Daily , Weekly. But H4 is the best.
Draw the trend lines from the tip of the bars.
Three examples:
True Trend Line
Look at the two pictures.
The first picture: False
Because the second peak is not below the first peak.
The second picture: True
The second peak is below the first peak.
Draw the trend lines from the tip of the bars.
The trend line should touch the first and second peaks. It’s so important. Some people don’t care about the second peak.
How to trade?
You should trade when the price comes back to the break point.It often happens. About 95%.
You need experience. Check the past to see more examples.
How to find the return points?
You can use Fibonacci for finding the return points.
Draw the Fibonacci from the start point of the trend line and end it at the highest or the lowest bar before the break point.
In these picture, the price has returned after touching the 161.80% or 61.80% of the Fibonacci.
Five examples:
Man, you got that BACKWARD.
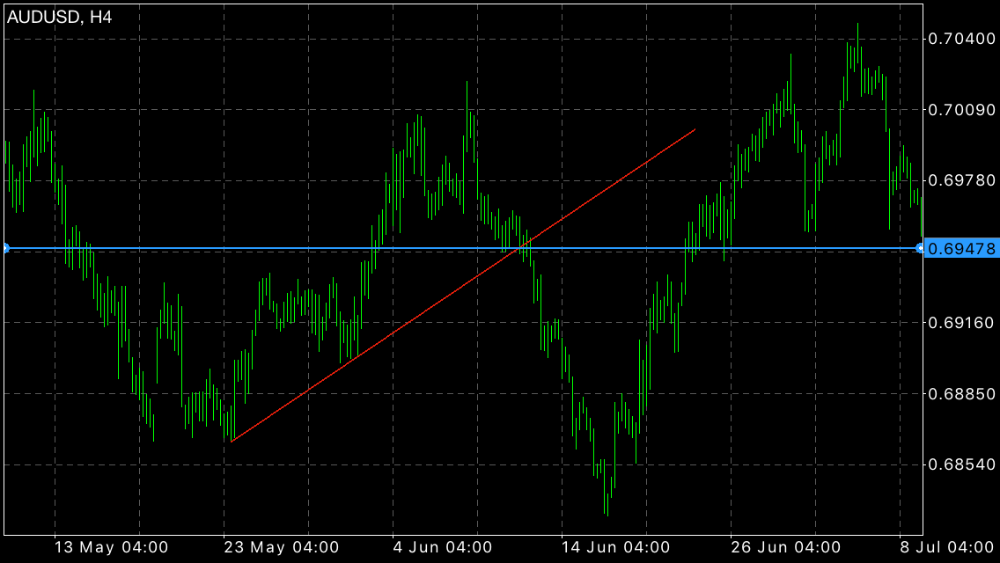
Prices return not to where it broke through the trendline, but to where the Support/Resistance and the Trendline are. If you look to the left of the chart, you would see that it coincides with one of the major support/resistance (or the trendlines).
Don't judge too soon. Check the past and see how many times the price comes back to the trend line. Very short or very long. The market constantly do this.