
intracity brain drain....I can see an argument for it.Not exactly. Integration separated a lot of these neighborhoods from their homegrown professionals, many of whom moved to the suburbs in the '70s and '80s. What remains is the left side of the distribution curve.
The school systems need expanded vocational training, but the problem is pretty much intractable.

You are using an out of date browser. It may not display this or other websites correctly.
You should upgrade or use an alternative browser.
You should upgrade or use an alternative browser.
77% tested at Baltimore high school read at elementary level, some at kindergarten level
- Thread starter ipatent
- Start date

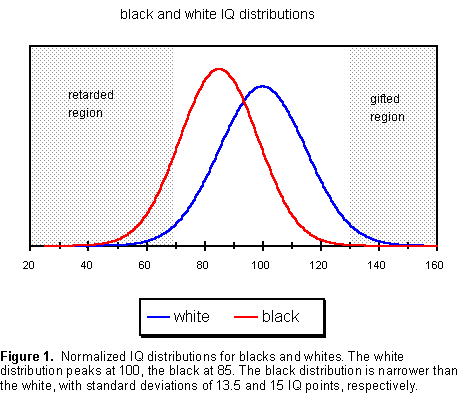
What's left in those neighborhoods is disproportionately in the shaded area on the left. Many blacks to the right of that have left and joined the middle class.
Again, this seems more like your personal beliefs. Anecdotally, I grew up in a black neighborhood and was very poor all throughout and I can tell you neither of your assumptions are correct. There are certainly intelligent people in impoverished neighborhoods and black folks are not unintelligent by and large.
Where did you get these IQ distribution charts? Not that it matters because even if true the vast majority of both white and black fall into normal range. Meaning those within the middle range area are fully capable of high academic achievement.
The crux of your argument seems to be that because there is a single standard deviation of about 15 points it proves some sort of inability to learn but that is not true at all. You can’t tell the difference between someone with a 90 IQ and someone with a 105 IQ anyway.
Additionally, outside of exceptionally high IQs, which you obviously don’t have because your chain of thought is 3 at best, IQ is very much influenced by living conditions such as nutrition and health, exposure to education early, etc - ie environmental factors associated with poverty.
https://www.researchgate.net/public...d_White_High_School_Students'_SAT_Performance
Where did you get these IQ distribution charts?
The same pattern shows up in IQ testing, the Civil Service Exam, the Armed Forces Qualifying Test, the PSAT, SAT, MCATs, LSATs, etc. It is written about extensively (albeit guardedly) in publications by think tanks like AEI and Brookings, by the Dept. of Education and reported on in such journalistic outlets as the NYT, WaPO, etc. as "the black-white testing gap" that unfortunately is not shrinking over time.
It is mainstream psychometric science, but they are careful how they address it because they apparently fear that the masses might not be able to absorb the truth in a benign manner. That's why so many people are unaware of the statistics until they dig. The "pseudoscience" decried by left wing antiracists is actually based on enormous amounts of data within the tried and true testing system that permeates all levels of American society. Here's one based on IQ testing (there have been a lot of peer reviewed studies based just on IQ testing):
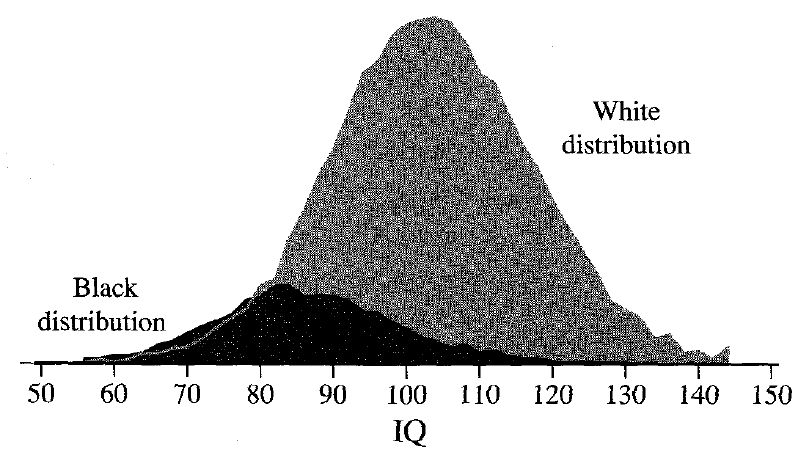
The problems we are seeing in the inner city are the left tail of the black distribution curve shown above that has been left behind in impoverished pockets. Keep in mind, an IQ below 80 used to be classified as "mentally retarded." Notice that there are plenty of blacks that score more highly than the average white (just proportionately fewer). Individual black scores as high as 200 have been reported. IQ is not driven by race. It is driven by gene combinations that did not spread evenly throughout the world from the original mutations.
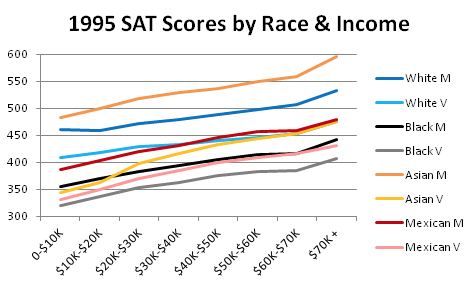
Here is the same pattern, this time based on the SATs:

Notice the same curve shapes and superimposition as in the IQ research, with an enormous sample size supporting the data. You wanted to know where the graphs come from. This one is from the College Board.
This chart shows that poverty isn't the primary driver. Poor whites and Asians outscore wealthy blacks.
The same pattern shows up in IQ testing, the Civil Service Exam, the Armed Forces Qualifying Test, the PSAT, SAT, MCATs, LSATs, etc. It is written about extensively (albeit guardedly) in publications by think tanks like AEI and Brookings, by the Dept. of Education and reported on in such journalistic outlets as the NYT, WaPO, etc. as "the black-white testing gap" that unfortunately is not shrinking over time.
It is mainstream psychometric science, but they are careful how they address it because they apparently fear that the masses might not be able to absorb the truth in a benign manner. That's why so many people are unaware of the statistics until they dig. The "pseudoscience" decried by left wing antiracists is actually based on enormous amounts of data within the tried and true testing system that permeates all levels of American society. Here's one based on IQ testing (there have been a lot of peer reviewed studies based just on IQ testing):
The problems we are seeing in the inner city are the left tail of the black distribution curve shown above that has been left behind in impoverished pockets. Keep in mind, an IQ below 80 used to be classified as "mentally retarded." Notice that there are plenty of blacks that score more highly than the average white (just proportionately fewer). Individual black scores as high as 200 have been reported. IQ is not driven by race. It is driven by gene combinations that did not spread evenly throughout the world from the original mutations.
Here is the same pattern, this time based on the SATs:
Notice the same curve shapes and superimposition as in the IQ research, with an enormous sample size supporting the data. You wanted to know where the graphs come from. This one is from the College Board.
This chart shows that poverty isn't the primary driver. Poor whites and Asians outscore wealthy blacks.
Again, you have no point but to say there is IQ average differences among races. I assume you’re trying to translate this into a predictor of academic performance based on race. But this brings us back to my original point, when you go to areas of high poverty among whites you find similar poor academic performance in predominantly white schools.
Round and round we go. Until you can account for the drop off in achievement of white poorer schools your theory moot. You have to control for outside factors or the general distribution of your IQ point is meaningless.
when you go to areas of high poverty among whites you find similar poor academic performance in predominantly white schools
There's a big difference in magnitude. Poverty and environment are drivers of poor performance as well, but genes account for 40-80 percent of performance.
In any event, I posted a chart that shows the influence of poverty.
There's a big difference in magnitude. Poverty and environment are drivers of poor performance as well, but genes account for 40-80 percent of performance.
In any event, I posted a chart that shows the influence of poverty.
I trifle with 40-80 percent of this.
I trifle with 40-80 percent of this.
Link
- Various studies find the heritability (Links to an external site.) of IQ between 0.4 and 0.8 in the United States, which is, depending on the study, a little less than half to substantially more than half of the variation in IQ among the children studied was due to variation in their genes.

Yup, that's where he's headed. And, look, he has arrived:He's saying blacks are low IQ but thinks he's being high IQ about it.
IOW, just another racist ET troll
The same pattern shows up in IQ testing, the Civil Service Exam, the Armed Forces Qualifying Test, the PSAT, SAT, MCATs, LSATs, etc. It is written about extensively (albeit guardedly) in publications by think tanks like AEI and Brookings, by the Dept. of Education and reported on in such journalistic outlets as the NYT, WaPO, etc. as "the black-white testing gap" that unfortunately is not shrinking over time.
It is mainstream psychometric science, but they are careful how they address it because they apparently fear that the masses might not be able to absorb the truth in a benign manner. That's why so many people are unaware of the statistics until they dig. The "pseudoscience" decried by left wing antiracists is actually based on enormous amounts of data within the tried and true testing system that permeates all levels of American society. Here's one based on IQ testing (there have been a lot of peer reviewed studies based just on IQ testing):
The problems we are seeing in the inner city are the left tail of the black distribution curve shown above that has been left behind in impoverished pockets. Keep in mind, an IQ below 80 used to be classified as "mentally retarded." Notice that there are plenty of blacks that score more highly than the average white (just proportionately fewer). Individual black scores as high as 200 have been reported. IQ is not driven by race. It is driven by gene combinations that did not spread evenly throughout the world from the original mutations.
Here is the same pattern, this time based on the SATs:
Notice the same curve shapes and superimposition as in the IQ research, with an enormous sample size supporting the data. You wanted to know where the graphs come from. This one is from the College Board.
This chart shows that poverty isn't the primary driver. Poor whites and Asians outscore wealthy blacks.
Go have your Special KKK cereal and get lost.The same pattern shows up in IQ testing, the Civil Service Exam, the Armed Forces Qualifying Test, the PSAT, SAT, MCATs, LSATs, etc. It is written about extensively (albeit guardedly) in publications by think tanks like AEI and Brookings, by the Dept. of Education and reported on in such journalistic outlets as the NYT, WaPO, etc. as "the black-white testing gap" that unfortunately is not shrinking over time.
It is mainstream psychometric science, but they are careful how they address it because they apparently fear that the masses might not be able to absorb the truth in a benign manner. That's why so many people are unaware of the statistics until they dig. The "pseudoscience" decried by left wing antiracists is actually based on enormous amounts of data within the tried and true testing system that permeates all levels of American society. Here's one based on IQ testing (there have been a lot of peer reviewed studies based just on IQ testing):
The problems we are seeing in the inner city are the left tail of the black distribution curve shown above that has been left behind in impoverished pockets. Keep in mind, an IQ below 80 used to be classified as "mentally retarded." Notice that there are plenty of blacks that score more highly than the average white (just proportionately fewer). Individual black scores as high as 200 have been reported. IQ is not driven by race. It is driven by gene combinations that did not spread evenly throughout the world from the original mutations.
Here is the same pattern, this time based on the SATs:
Notice the same curve shapes and superimposition as in the IQ research, with an enormous sample size supporting the data. You wanted to know where the graphs come from. This one is from the College Board.
This chart shows that poverty isn't the primary driver. Poor whites and Asians outscore wealthy blacks.