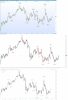
I have never traded futures before, because I couldn't understand how different charts of the same trading instrument are related to each other. For example below you can see 3 continuous charts of Brent crude oil. I have marked down certain highs and lows so that one can see the differences between them.
One can see that differences are not just a few ticks.
Can anybody explain what is going on here?
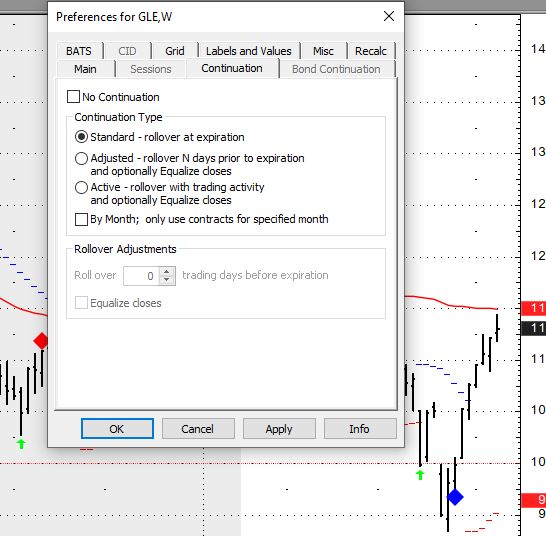
I heard from one trader who works in a London based futures prop trading firm that they all use 'back adjusted continuous futures charts' for trading, as all traders in prop firms do. So they all see the same support resistance levels. I also want to have these support resistance levels on my charts, but not sure where to find the correct charts to draw levels from and actually to trade off of.
One can see that differences are not just a few ticks.
Can anybody explain what is going on here?
I heard from one trader who works in a London based futures prop trading firm that they all use 'back adjusted continuous futures charts' for trading, as all traders in prop firms do. So they all see the same support resistance levels. I also want to have these support resistance levels on my charts, but not sure where to find the correct charts to draw levels from and actually to trade off of.