Congrats for the year! I guess it is time to look back and analyze your performance.
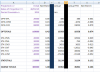
The last 12 weeks' performance is scary to say the least. The first 6 weeks ( Oct- mid-Nov) you made 242K (scary good) and the second 6 weeks you lost 163K (scary bad). So basicly in the same timeframes of 6-6 weeks you lost 2/3rd of the previous gains. That is something to think about...
Also maybe you could give something more positive title to the 2015 journal, like Back in the saddle again, or The road to consistency...
Best wishes for the next year and thanks for the journal!!