
You are using an out of date browser. It may not display this or other websites correctly.
You should upgrade or use an alternative browser.
You should upgrade or use an alternative browser.
120 years of bull and bear markets
- Thread starter Maverick2608
- Start date
Thats why- i track SPY;
it went doWn more than 20% in 2018.[S&P 500 equal weight went down more than that, past 10 years, but i dont cherry pick / track stuff like that, much LOL]
 ,
, 
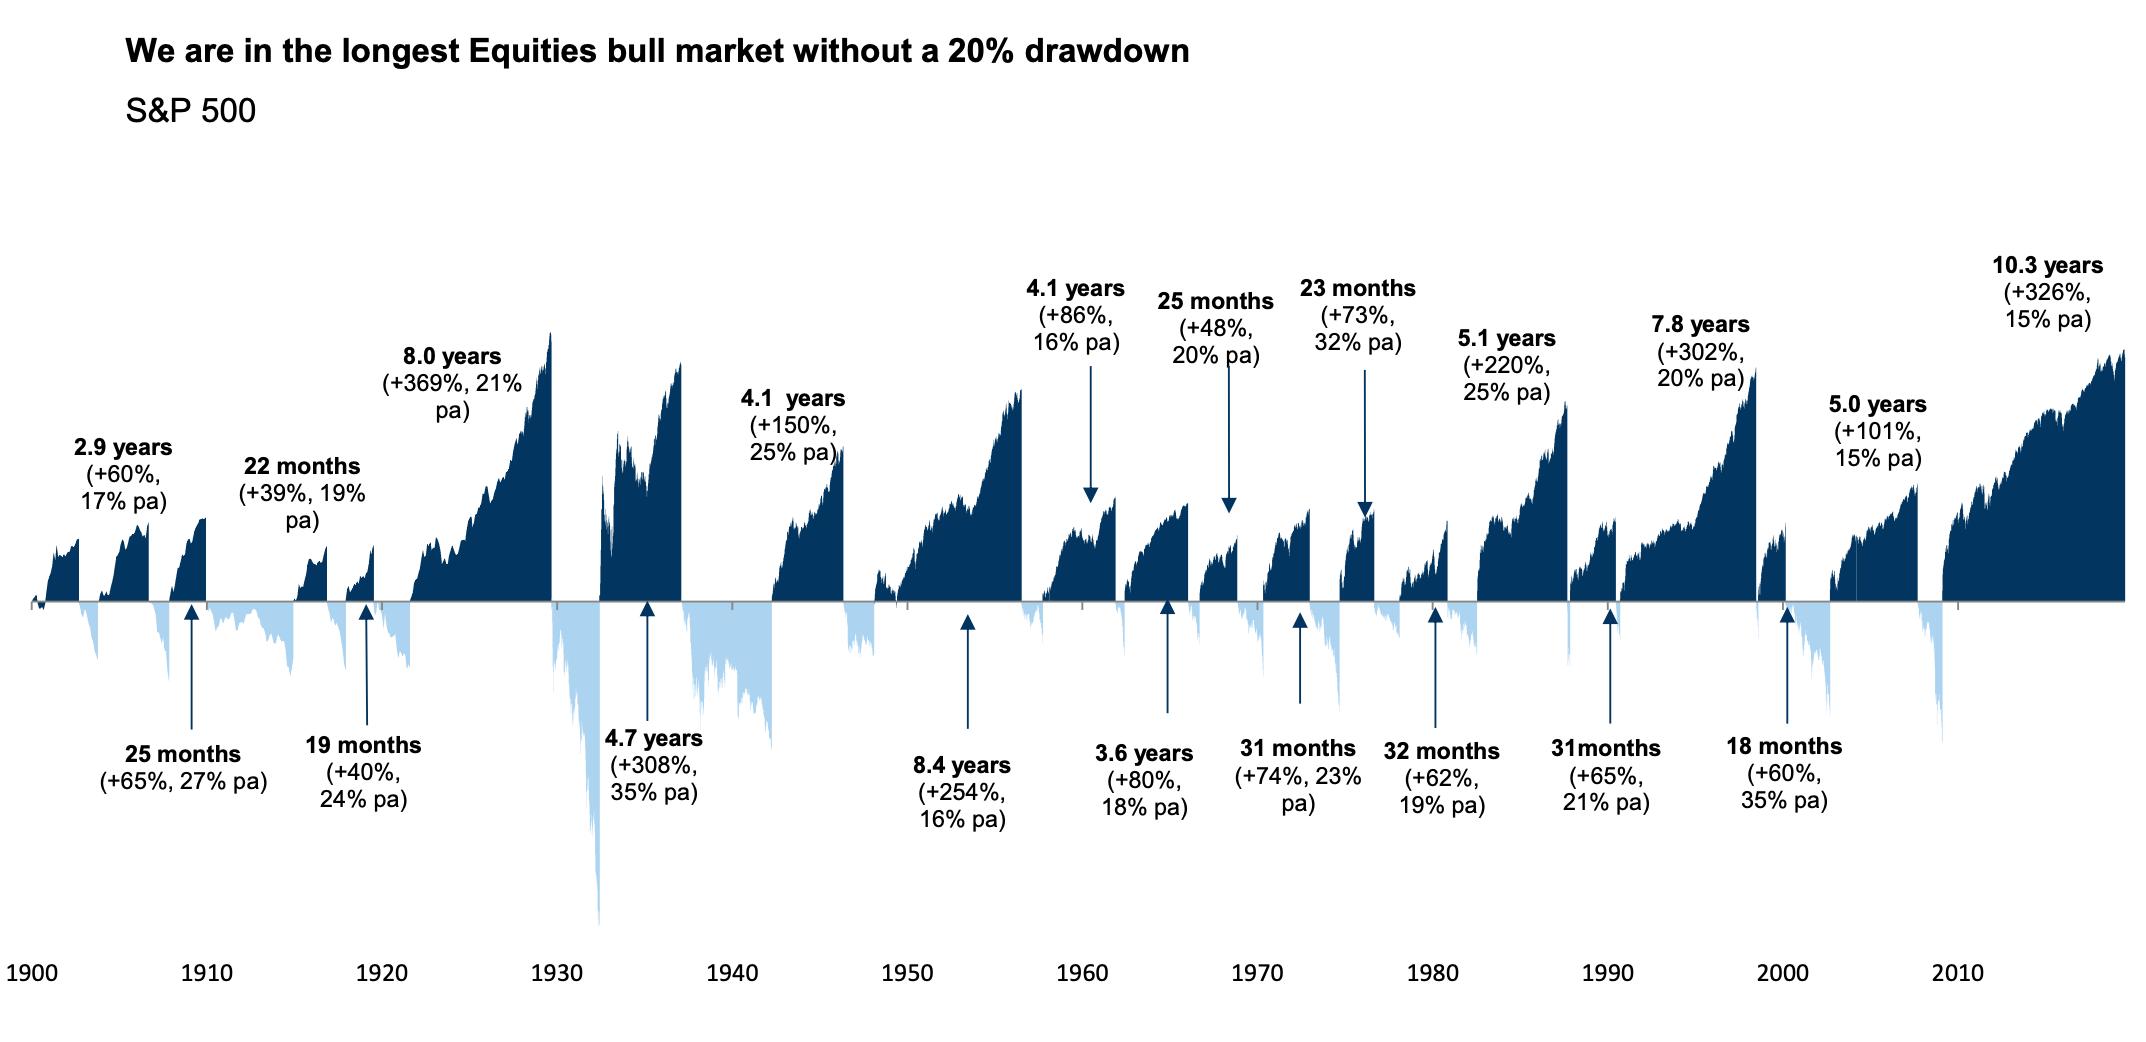
Sobering to see this bull market lasting longer than the bull market in the 1920s and rising nearly as much. A long term chart of US Treasury Bonds would be sobering as well.
It would be wise to visualize and prepare for, say, what a 6 sigma market event would have on one’s financial position, either directly or indirectly, such a job loss and civil unrest.
%%
OK according to your chart we put in a bottom in 1930+/ $. One lady asked 1930 +1?? I said no,that is 1930 more or less LOL
 ,
,%%cool charts. tell u nothing
That's why i dont like those mountain charts much ; markets never move like that.They could =i meant they never have in the past 200+ years LOL But in fairness, the data error of leaving out the 20%+ corrcection/bear trend in 2018=that's not a mountain chart error-its simply a SPY chart error .Thanks
, Wow! Great chart, a wake up call for me. Thank you.
Had a great run since 2010, it is time to scale back.