Depending on how you model it, ES is either slightly over-bought or, it's heading in that direction. The constant here is 3641 and in the short-term I would think any significant excursion above that would warrant some "shorting research". That's probably not news for anyone watching it. If you're bored or just looking for some additional insight though, I'll break down my current thoughts on it below.
Let's go!
ES: 6 years of training data, 30 day forecast. Price logged.

Any signal generated from six years of data (quant, fundamental and/or technical), "should be" more robust over-time as it accounts for all the events and regime changes that have occurred in that time frame. That's a good thing, the downside is, if your current regime is fundamentally different and/or evolving (and this moment in time certainly feels that way) it may miss a lot of the current nuances (volatility, momentum, name your favorite factor here that is driving price...). So as we dig into the current ES price action, we look at this as a place to start, but not necessarily finish.
Right now we see price pushing up and testing the most upper bound of the forecasted range (resistance for ease). This doesn't make me want to toss the wallet at "shorts" but it does have me thinking there could be some opportunity here to ride a pull-back. Ideally what I really want to see is a pop into the white-space, which would get us above 3641. At those levels I'd consider giving up some latte money for a test lower.
ES: 4 years of training data, 30 day forecast. Price logged.

With four years of training data the picture changes a little, we're not to or above the upper bound, and I don't see any real reason to increase exposure beyond what I've established above. It is worth noting here that, as above in our 6y chart, the blue range has a small dip in the forecast. This could play to our shorting favor, if the data is still representative of the broader cycles.
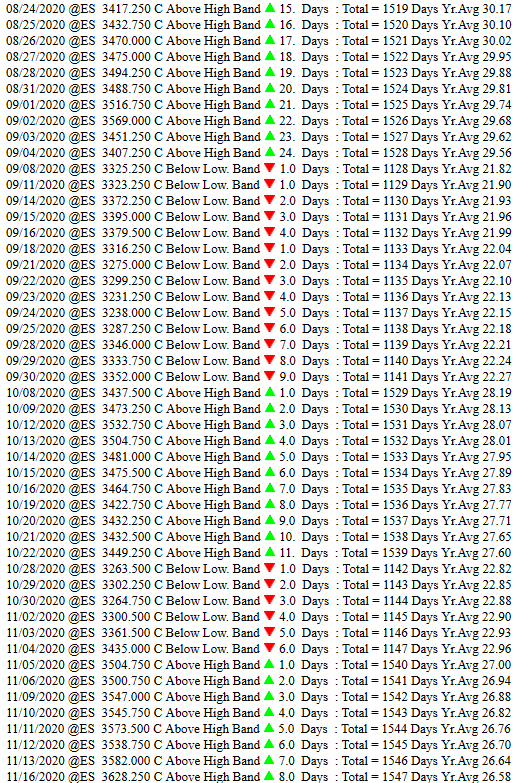
ES: 2 years of training data, 30 day forecast. Price logged.

The final piece of this puzzle is our 4 year model and forecast. Here we see the volatility of the current regime having a much great impact on current support and resistance areas, and there is a ways to go before we can get too excited about shorting this. And with that said, given the overall forecast in this particular model for a continuation of the bullish trend, longs off a dip could make sense.
So let's recap right quick:
- I think we have some potential here for a move lower.
- We nearly have a breach in our 6yr model, and I'm "this" close to allocating a "small fraction of max" on that signal. (Other models not discussed would also have to be in gear with that.)
- If this should go into a triple-breach, where price action ends up in the white space on all three forecasts, I'd have to seriously consider a "closer to max position".
Let's go!
ES: 6 years of training data, 30 day forecast. Price logged.
Any signal generated from six years of data (quant, fundamental and/or technical), "should be" more robust over-time as it accounts for all the events and regime changes that have occurred in that time frame. That's a good thing, the downside is, if your current regime is fundamentally different and/or evolving (and this moment in time certainly feels that way) it may miss a lot of the current nuances (volatility, momentum, name your favorite factor here that is driving price...). So as we dig into the current ES price action, we look at this as a place to start, but not necessarily finish.
Right now we see price pushing up and testing the most upper bound of the forecasted range (resistance for ease). This doesn't make me want to toss the wallet at "shorts" but it does have me thinking there could be some opportunity here to ride a pull-back. Ideally what I really want to see is a pop into the white-space, which would get us above 3641. At those levels I'd consider giving up some latte money for a test lower.
ES: 4 years of training data, 30 day forecast. Price logged.
With four years of training data the picture changes a little, we're not to or above the upper bound, and I don't see any real reason to increase exposure beyond what I've established above. It is worth noting here that, as above in our 6y chart, the blue range has a small dip in the forecast. This could play to our shorting favor, if the data is still representative of the broader cycles.
ES: 2 years of training data, 30 day forecast. Price logged.
The final piece of this puzzle is our 4 year model and forecast. Here we see the volatility of the current regime having a much great impact on current support and resistance areas, and there is a ways to go before we can get too excited about shorting this. And with that said, given the overall forecast in this particular model for a continuation of the bullish trend, longs off a dip could make sense.
So let's recap right quick:
- I think we have some potential here for a move lower.
- We nearly have a breach in our 6yr model, and I'm "this" close to allocating a "small fraction of max" on that signal. (Other models not discussed would also have to be in gear with that.)
- If this should go into a triple-breach, where price action ends up in the white space on all three forecasts, I'd have to seriously consider a "closer to max position".