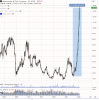
Possible double top... not likely THE BIG TOP, but perhaps for a corrective period. Some are calling "top" and for shorts.
It would be tactically reasonable to play 18700 as a "pivot"... long above, flat or short below.
FWIW...

It would be tactically reasonable to play 18700 as a "pivot"... long above, flat or short below.
FWIW...
Last edited: